Where to Find a Design Storm Hyetograph Generation Spreadsheet
To obtain a Design Storm Hyetograph Generation excel spreadsheet, click here to visit our spreadsheet store. For use in stormwater management calculation, you can buy a convenient Design Storm Hyetograph generation excel spreadsheet for a very reasonable price? This spreadsheet will generate a design storm hyetograph using the Chicago storm model, a triangular storm model or the “alternating blocks” procedure in either U.S. or S.I. units. Read on for information about Excel spreadsheets that can be used for design storm hyetograph generation.
Models for Design Storm Hyetograph Generation
Several different hyetograph models can be used for design storm hyetograph generation, including the Chicago storm, triangular, or rectangular (constant intensity design storm) models or the “alternating blocks” procedure for constructing a design storm hyetograph. An initial step typically needed is the generation of an equation for storm intensity as a function of storm duration at the design location, for the design recurrence interval.
The Chicago Storm Hyetograph
 For example, the Chicago storm hyetograph model uses the equation at the left for the portion of the hyetograph before the peak storm intensity. A slightly different equation is used for the portion of the design
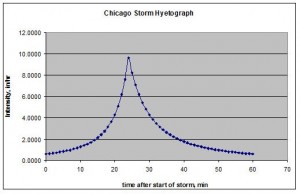
  storm hyetograph that is after the peak storm intensity. The resulting hyetograph has the general shape shown in the diagram at the right. A user specified parameter is r, which is the fraction of the hyetograph that is before the point of peak storm intensity. The triangular hyetograph model is similar in shape, but the lines before and after the peak storm intensity are straight instead of curved.
Example Design Storm Hyetograph Generation Excel Spreadsheet
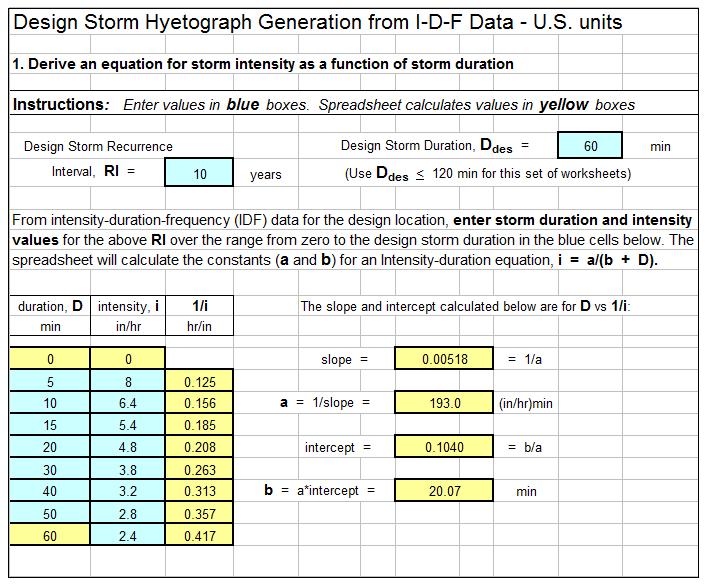
The Design Storm hyetograph generation excel spreadsheet partially shown in the image below can be used to generate a triangular or Chicago storm hyetograph as discussed above. The portion shown is for generating an equation for storm intensity as a function of storm duration. This Excel spreadsheet, as well as others for stormwater management calculations, is available in either U.S. or S.I. units for a very reasonable price in our spreadsheet store.
References
1. American Iron and Steel Institute, Modern Sewer Design, 4th Edition, 1999.
2. Bengtson, Harlan H., “Chicago Storm Hyetograph Generation Spreadsheet,” an online informational blog article.


