Backwater Curve Calculations Spreadsheet

Where to Find a Backwater Curve Calculations Spreadsheet

To obtain a backwater curve calculations spreadsheet to calculate surface profiles for non uniform open channel flow, click here to visit our spreadsheet store.  Obtain a convenient, easy to use backwater curve calculations spreadsheet at a reasonable price.  Read on for information about the use of an Excel spreadsheet for non uniform flow open channel surface profile step wise calculations.

Background on Non Uniform and Uniform Open Channel Flow
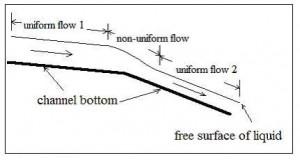
uniform nonuniform flow diagram - backwater curve calculations spreadsheetsThe diagram at the right illustrates uniform and nonuniform open channel flow.  Uniform flow in an open channel consists of a constant volumetric flow of liquid through a reach of channel with a constant bottom slope, surface roughness, and hydraulic radius (that is constant channel size and shape).  For those constant channel conditions, the water will flow at a constant depth, called the normal depth, for the  particular channel conditions and volumetric flow rate. The diagram shows a reach of uniform open channel flow, followed by a change in bottom slope that causes non-uniform flow, ending with another reach of uniform open channel flow.  This article is about means of calculating the surface profile (depth vs distance down the channel) for a reach of non uniform flow.


Classifications of Non Uniform Open Channel Flow for a Backwater Curve Calculations Spreadsheet
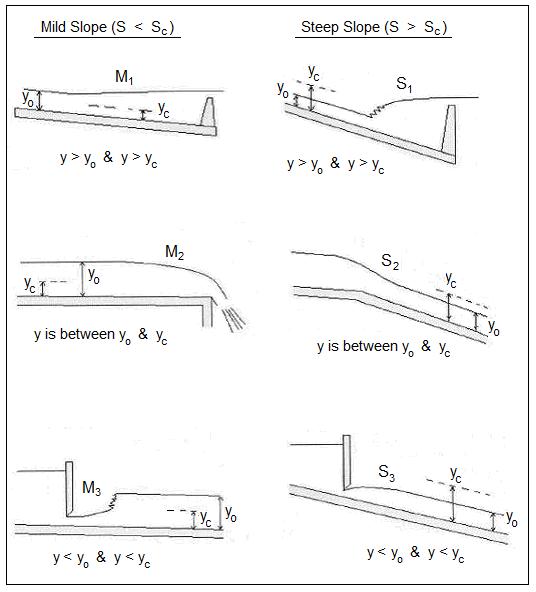
backwater curve calculations spreadsheet - uniform surface profile typesClassifications of Non Uniform Open Channel Flow (Mild or Steep Channel Slope)

The diagram above shows the three possible non uniform flow patterns for a mild slope (channel slope less than the critical slope) and the three for a steep slope (channel slope greater than the critical slope).  The three mild slope classifications are M1, M2, and M3.  The “M” indicates mild slope and the number shows the relationship among depth of flow, y, critical depth, yc, and normal depth, yo , as shown in the diagram.  Similarly the three steep slope classifications are S1, S2, and S3, with the numbers having the same meaning.  The diagram shows a typical physical situation that will give rise to each of these six types of non uniform open channel flow.

The Energy Equation for a Backwater Curve Calculations Spreadsheet

The energy equation (the first law of thermodynamics applied to a flowing fluid), which has many applications in fluid mechanics, can be used for non uniform open channel flow surface profile stepwise calculations.  The diagram below shows the parameters that will be used at each end of a reach of channel with non uniform flow.
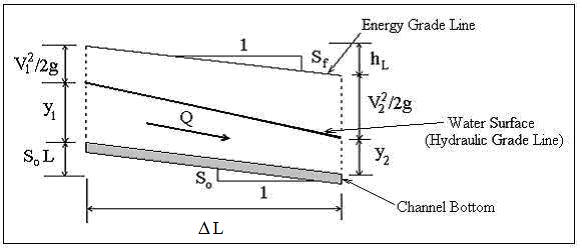
Backwater curve calculations spreadsheet - non uniform flow parametersA Reach of Open Channel with Non Uniform Flow

The energy equation written across a reach of channel is illustrated graphically in the diagram above.  The sum of the three items on the upstream end of the channel reach must equal the sum of the three items on the downstream end of the channel reach, giving the equation:

Where the parameters in the equation are as follows:

  • y1 =  the upstream depth of flow in ft (m for S.I. units)
  • y2 =  the downstream depth of flow in ft (m for S.I. units)
  • V1 =  the upstream average velocity in ft/sec (m/s for S.I. units)
  • V2 =  the downstream average velocity in ft/sec (m/s for S.I. units)
  • g  =  the acceleration due to gravity  =  32.17 ft/sec2 (9.81 m/s2 for S.I. units)
  • ΔL  =  the horizontal length of the channel reach in ft (m for S.I. units)
  • So =  the bottom slope of the channel, which is dimensionless
  • Sf =  the slope of the energy grade line (thus head loss is hL = SfΔL)

For specified flow rate, Q, channel bottom slope, So , Manning roughness coefficient, n, and channel width for a rectangular channel, the energy equation can be used to calculate the length, ΔL, for transition from a known upstream depth, y1 , to a selected downstream depth, y2 .  This process can be repeated as many times as necessary to determine the total distance to a specified downstream depth.

The energy equation can be rearranged to give the following equation for ΔL:

The Manning equation is typically used to calculate the slope of the energy grade line, Sf .  Although the Manning equation only applies for uniform flow, the use of mean cross-sectional area and mean hydraulic radius with a relatively small step for the calculation gives a good approximation.  The equation for Sf is as follows:

Sf =  {Qn/[1.49Am(Rhm2/3)]]}2, where  Am is the mean area and Rhmis the mean hydraulic radius between sections 1 and 2.  For S.I. units, the 1.49 constant in this equation becomes 1.00.

Screenshot of a Backwater Curve Calculations Spreadsheet

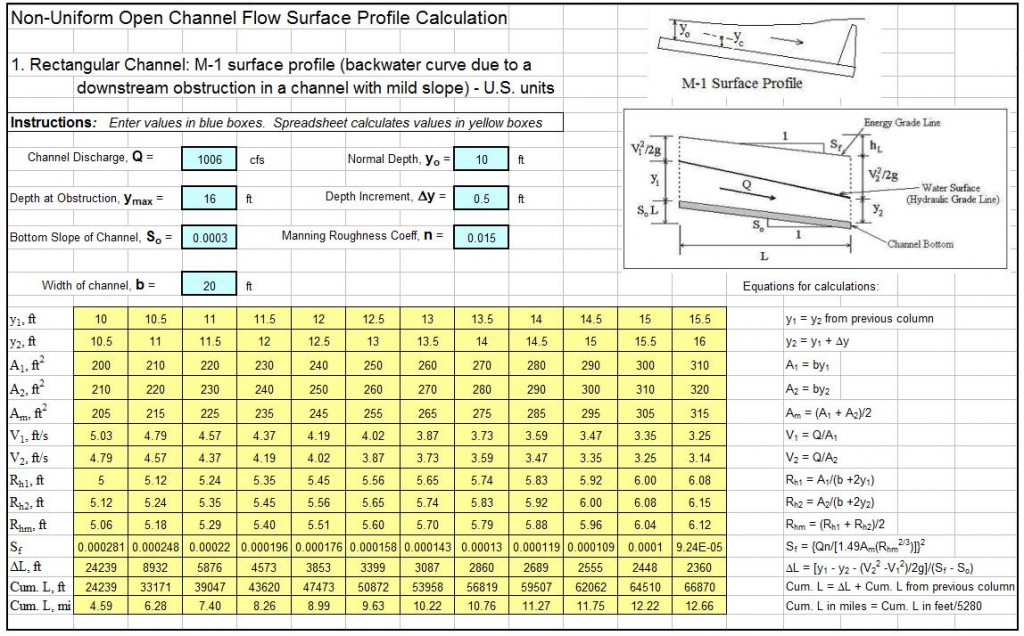
Consider a 20 ft wide rectangular channel with bottom slope equal to 0.0003, carrying 1006 cfs.  The normal depth for this flow is 10 ft.   An M1 backwater curve is generated due to a downstream obstruction.  Calculate the channel length for the transition from a depth of 12 ft to a depth of 12.5 ft in this backwater curve.

Solution: The spreadsheet shown in the screenshot below shows the solution.  It actually has the entire M1 curve from a depth of 10 ft to a depth of 16 ft.  It shows DL for the transition from 12 ft depth to 12.5 ft depth to be 3853 ft.

The Excel spreadsheet template shown above can be used to calculate an M1 surface profile for a rectangular channel with specified flow rate, bottom width, bottom slope, and Manning roughness coefficient.  Why bother to make these calculations by hand?  This backwater curve calculations spreadsheet and others with similar calculations for a trapezoidal channel, and for any of the six mild or steep nonuniform flow surface profiles are available in either U.S. or S.I. units at a very low cost in our spreadsheet store.

References

1. Munson, B. R., Young, D. F., & Okiishi, T. H., Fundamentals of Fluid Mechanics, 4th Ed., New York: John Wiley and Sons, Inc, 2002.

2. Chow, V. T., Open Channel Hydraulics, New York: McGraw-Hill, 1959.

3. Bengtson, Harlan H., Open Channel Flow II – Hydraulic Jumps and Supercritical and Nonuniform FlowAn online, continuing education course for PDH credit.

4.  Bengtson, Harlan H., “Non Uniform Flow in Open Channels“, an online blog article

Flow Through Annulus Calculator Excel Spreadsheet

Where to Find an Excel Spreadsheet Flow Through Annulus Calculator

For an Excel spreadsheet liquid flow through annulus calculatorclick here to visit our spreadsheet store.  Look in the “Non-Circular Duct flow Calculations” category.  Obtain a convenient, easy to use spreadsheet liquid flow through annulus calculator at a reasonable price. Read on for information about the use of Excel spreadsheets to calculate pressure drop or liquid flow rate for annulus flow.

Friction Factor-Pipe Flow Background for a Liquid Flow Through Annulus Calculator

A liquid flow through annulus calculator spreadsheet uses calculations that are very similar to those for flow through a pipe.  The main difference is use of the hydraulic diameter for flow through an annulus in place of the pipe diameter as used for pipe flow.  For details of pipe flow calculations, see the article, “Friction Factor/Pipe Flow Calculations with Excel Spreadsheets.”

Calculation of the Hydraulic Diameter for a Liquid Flow Through Annulus Calculator

The general definition of hydraulic diameter for flow through a non-circular cross-section is:                               DH = 4(A/P),    where:

  • DH is the hydraulic diameter in ft (m for S.I. units)
  • A is the cross-sectional area of flow in sq ft (sq m for S.I. units)
  • P is the wetted perimeter in ft (m for S.I. units)

For a flow through annulus calculator:

  • A = (π/4)(Do2 –  Di2)
  • P  =  π(Do + Di)

Where Do is the inside diameter of the outer pipe and Di is the outside diameter of the inner pipe.  Substituting for A and P in the definition of  DH and simplifying gives:

DH =  Do – Di

Equations for the Liquid Flow Through Annulus Calculator

The Darcy Weisbach equation for flow in an annulus is:  hL = f(L/DH)(V2/2g), with the parameters in the equation as follows: hL is the frictional head loss for flow of a liquid at average velocity, V, through an annulus of length, L, and hydraulic diameter, DH .  The Reynolds number for the flow (Re) and the relative roughness of the pipe (Manning roughness coefficient /pipe diameter, ε/D) are needed to get a value for the friction factor, f.  The Moody friction factor diagram and equations for calculating the friction factor, f, are presented and discussed in the article, “Friction Factor/Pipe Flow Calculations with Excel Spreadsheets.”

Spreadsheets for the Liquid Flow Through Annulus Calculator

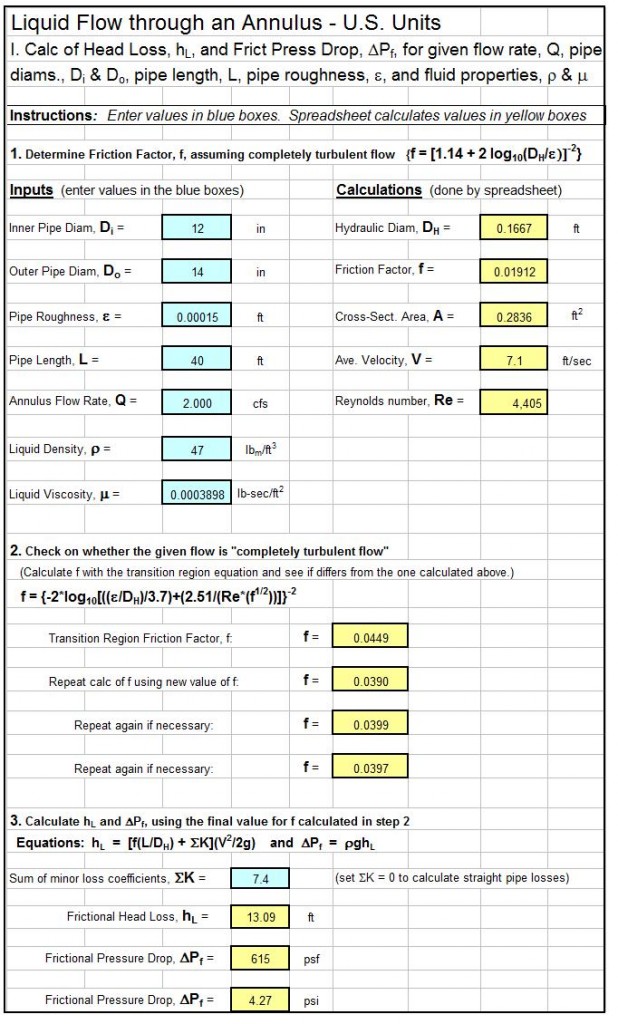
The Excel spreadsheet screenshot below shows a liquid flow through annulus calculator spreadsheet for calculation of the head loss and frictional pressure drop for flow of a liquid through an annulus.  Based on the input values for the annulus diameters and length as well as liquid flow rate and properties, the spreadsheet will calculate the head loss and frictional pressure drop.

For low cost, easy to use spreadsheets to make these calculations as well as similar calculations for liquid flow in an annulus or for pipe flow calculations, in S.I. or U.S. units, click here to visit our spreadsheet store.

liquid flow through annulus calculator spreadsheetReferences

1.  Munson, B. R., Young, D. F., & Okiishi, T. H., Fundamentals of Fluid Mechanics, 4th Ed., New York: John Wiley and Sons, Inc, 2002.

2. Bengtson, H.H., Pipe Flow/Friction Factor Calculations with Excel, an online continuing education course for Professional Engineers.

3.  Bengtson, Harlan H.,  Advantages of Spreadsheets for Pipe Flow/Friction Factor Calculations,  an e-book available through Amazon.com.

Partially Contracted V-Notch Weir Excel Spreadsheets

Where to Find a Partially Contracted V-Notch Weir Excel Spreadsheet

To obtain a Partially Contracted V-notch weir Excel spreadsheet for , click here to visit our spreadsheet store. Why use online calculators or hand calculations when you can buy a partially contracted V-notch weir spreadsheet for only $11.95.  Read on for information about Excel spreadsheets that can be used as v-notch weir open channel flow calculators for partially contracted flow.

For background on fully contracted v notch weir calculations, see the article, “V-Notch Weir Calculator Excel Spreadsheet.”   That article gives general information about V notch weirs and equations and conditions required for fully contracted v notch weir calculations.
Partially Contracted V Notch Weir Calculations for a 90o Notch Angle

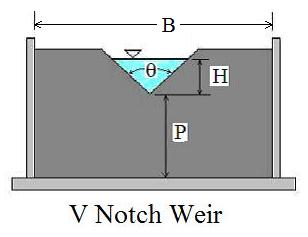
Partially contracted v-notch weir excel spreadsheet diagram

The equation shown below is recommended by the U.S. Dept. of the Interior, Bureau of Reclamation in their Water Measurement Manual (ref #1 below) for calculations with a partially contracted, 90o, v notch, sharp crested weir with free flow conditions and 0.4 ft < H < 2 ft (0.05 m < H < 0.38 m).

In U. S. units:  Q = 4.28H2.48, where Q is discharge in cfs and H is head over the weir in ft.

In S.I. units:  Q = 1.36H2.48, where Q is discharge in  m3/s and H is head over the weir in m.

The conditions for the v notch weir to be fully contracted are:

H/P < 1.2,    H/B < 0.4,    P > 0.33 ft (0.1 m),   B > 2 ft (0.6 m)

The diagram above shows the parameters H, P, θ and B for a v notch weir as used for open channel flow rate measurement in a partially contracted v-notch weir excel spreadsheet.

Screenshot of a Partially Contracted V Notch Weir Excel Spreadsheet

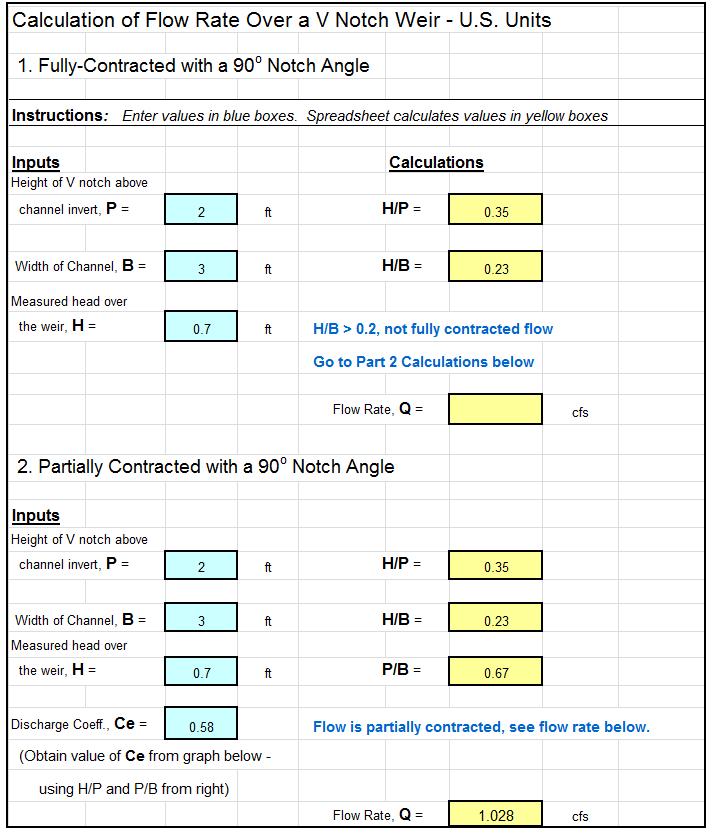
The screenshot below shows a partially contracted v notch weir excel spreadsheet for making 90o, partially contracted v-notch weir calculations in U.S. units.  Based on specified values for H, P, & B (and a value for Ce from a graph on the spreadsheet), the spreadsheet checks on whether the required conditions for partially contracted flow are met and then calculates the flow rate, Q.  This Excel spreadsheet and others for v notch weir calculations are available in either U.S. or S.I. units at a very low cost (only $11.95)  in our spreadsheet store.

partially contracted v-notch weir spreadsheet screenshot

References:

1. U.S. Dept. of the Interior, Bureau of Reclamation, 2001 revised, 1997 third edition, Water Measurement Manual, available for online use or download at: http://www.usbr.gov/pmts/hydraulics_lab/pubs/wmm/index.htm.

2. Bengtson, Harlan H., “Sharp Crested Weirs for Open Channel Flow Measurement,” an Amazon Kindle ebook

3. Bengtson, Harlan H., Open Channel Flow III – Sharp Crested Weirs, an online continuing education course for PDH credit, http://www.online-pdh.com/engcourses/course/view.php?id=87

4. Munson, B. R., Young, D. F., & Okiishi, T. H., Fundamentals of Fluid Mechanics, 4th Ed., New York: John Wiley and Sons, Inc, 2002.

Activated Sludge Calculations in a Solids Mass Balance Spreadsheet

Where to Find a Solids Mass Balance Spreadsheet for Activated Sludge Calculations

For Excel solids mass balance spreadsheets to make activated sludge calculations calculations, click here to visit our spreadsheet store.  Obtain a convenient, easy to use spreadsheet for solids mass balance activated sludge calculations for only $22.95. Read on for information about the use of an Excel spreadsheet for estimating the effect of recycle flow, BOD and TSS through solids mass balance activated sludge calculations.

Solids Mass Balance Background for Activated Sludge Calculations

Several streams from sludge treatment processes are typically recycled back into the wastewater treatment plant inflow.  Examples are sludge thickener overflow, anaerobic digester supernatant, aerobic digester supernatant, centrate from centrifuge dewatering, and filtrate from filtration dewatering.  The liquid flow, BOD load, and TSS load in these recycled streams contribute to the wastewater flow to be handled by the mainstream wastewater treatment processes.

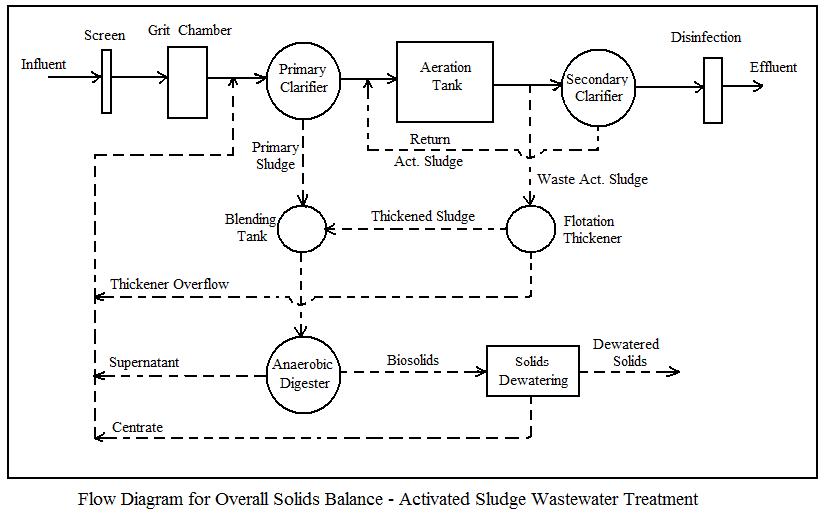
An iterative solids mass balance is an organized procedure for estimating the total flow rate, BOD load, and TSS load in the recycled flows from sludge treatment and handling processes.  This type of calculation is illustrated in an eight page example in Metcalf and Eddy (Reference #1).  The flow diagram below shows a typical set of sludge treatment processes and recycle flows for an activated sludge plant.

Solids Flow Diagram for Activated Sludge Calculations


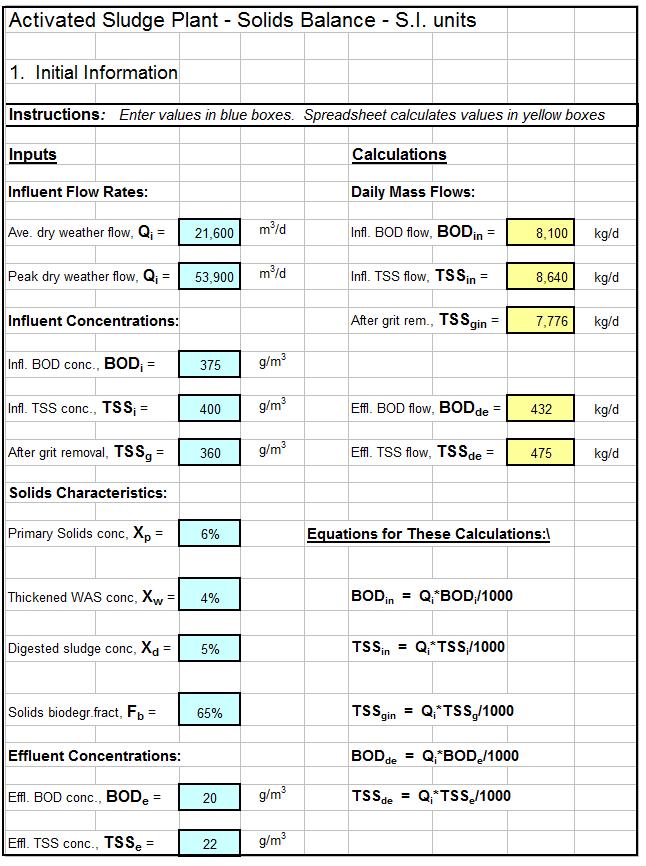
Activated Sludge Calculations Influent and Effluent Inputs for Spreadsheet

General information about the wastewater influent flow and characteristics will need to be input to the spreadsheet along with information about target effluent characteristics.  The screenshot below shows typical influent and effluent inputs needed.

Activated Sludge Calculations Solids Mass Balance Spreadsheet

Solids Mass Balance Activated Sludge Calculations for Each Treatment Process

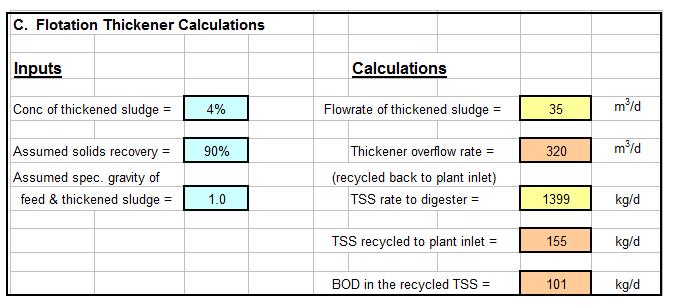
The next step is solids mass balance calculations for each of the treatment processes, leading to estimates of the recycle flow rate, BOD load and TSS load for each recycle stream.  For a wastewater treatment plant with the flow diagram shown above, there would need to be solids mass balance calculations for the primary clarifier, the aeration tank/secondary clarifier, the sludge thickener, the anaerobic digester, and the sludge dewatering process.  The screenshot below shows typical inputs and outputs for a solids mass balance over a sludge thickener.

Screenshot thickener calculations - Activated Sludge Calculations

Similar calculations would be made for each of the wastewater treatment and sludge treatment/management processes, leading to information about recycle flow rate, BOD load, and TSS load, for each recycle stream as shown in the summary tables in the next section.  After completion of the first iteration, the recycle flowrate, BOD load and TSS load are added to values for those parameters for the incoming wastewater and all of the solids mass balance calculations are repeated in a second iteration.

Summary Tables

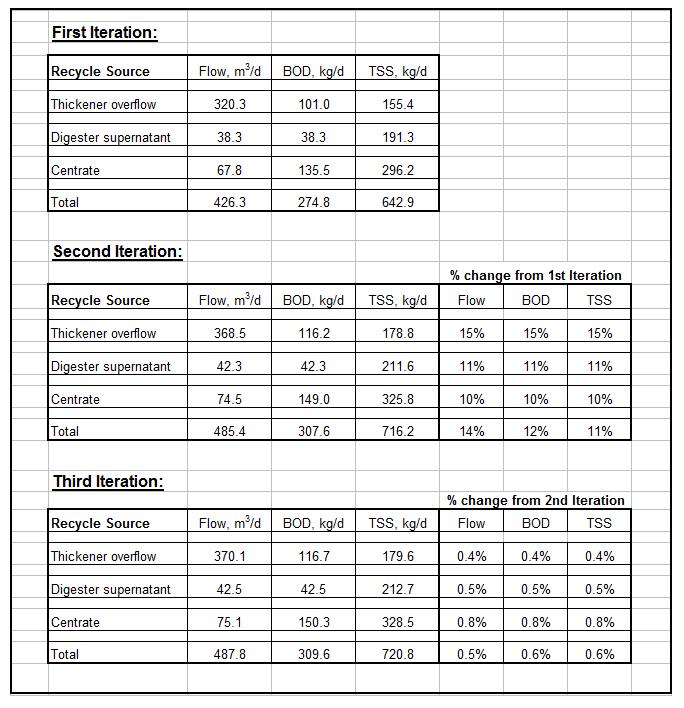
The screenshot below shows a set of tables summarizing the results of the calculated recycles flows from the first three iterations of the activated sludge calculations.   Spreadsheets are available to make this type of solids mass balance calculations in either U.S. or S.I. units at a very low cost (only $22.95) in our spreadsheet store.  These spreadsheets are set up to make the solids mass balance calculations for four iterations.

Summary Tables for Activated Sludge Calculations Solids Mass Balance

References

1. Metcalf & Eddy, Inc, (revised by Tchobanoglous, G, Burton, F.L., Stensel, H.D., Wastewater Engineering Treatment and Reuse, 4th Edition, New York, NY, 2003.

2. Bengtson, Harlan H.,  “Activated Sludge Solids Mass Balance Spreadsheet,”  an online blog article.


Activated Sludge Secondary Clarifier Design Spreadsheets

Where to Find Activated Sludge Secondary Clarifier Design Spreadsheets

For an Excel spreadsheet for activated sludge secondary clarifier design calculations, click here to visit our spreadsheet store.  Obtain a convenient, easy to use primary and secondary clarifier design spreadsheets for only $11.95.  Read on for information about the use of an Excel spreadsheet for activated sludge secondary clarifier design calculations.

Activated Sludge Secondary Clarifier Design Parameters

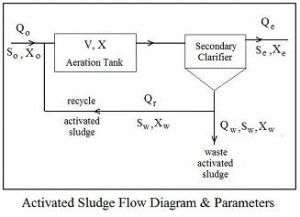
Flow Diagram for Activated Sludge Secondary Clarifier DesignThe parameters typically used for activated sludge secondary clarifier design are the surface overflow rate (SOR), solids loading rate (SLR), and weir overflow rate (WOR).  Activated sludge parameters are shown in the flow diagram at the right.  The equations defining these three parameters are:

SOR = Qo/A,  SLR = (Qo + Qr)X/A, and  WOR = Qo/L,  where:

  • Qo = primary effluent flow rate in MGD (U.S.) or m3/d (S.I.)
  • A = total surface area for secondary clarifier(s) in ft2 (U.S.) or m2 (S.I.)
  • Qr = recycle activated sludge flow rate in MGD (U.S.) or m3/d (S.I.)
  • X = mixed liquor activated sludge solids concentration in mg/L (U.S. or S.I.)
  • L = length of secondary clarifier effluent weir in ft (U.S.) or m (S.I.)

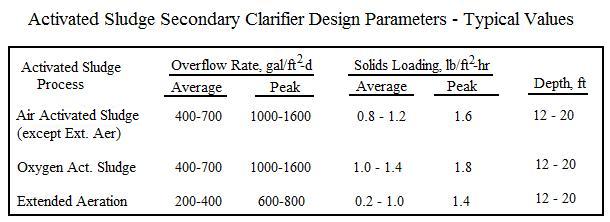
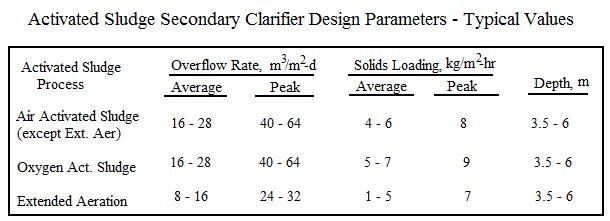
Typical values of surface overflow rate and solids overflow rate for activated sludge secondary clarifier design are shown in the tables below:

Design Parameters for Activated Sludge Secondary Clarifier Design

Activated Sludge Secondary Clarifier Design Parameters

Calculation of Activated Sludge Secondary Clarifier Surface Area

The equation for calculating the needed activated sludge secondary clarifier surface area from a design SOR value with units as shown above is:  A = Qo*106/SOR

The formula for calculating activated sludge secondary clarifier surface area from a design value of SLR with parameter units as shown above is:  A = (Qo + Qr)*8.34*X/SLR

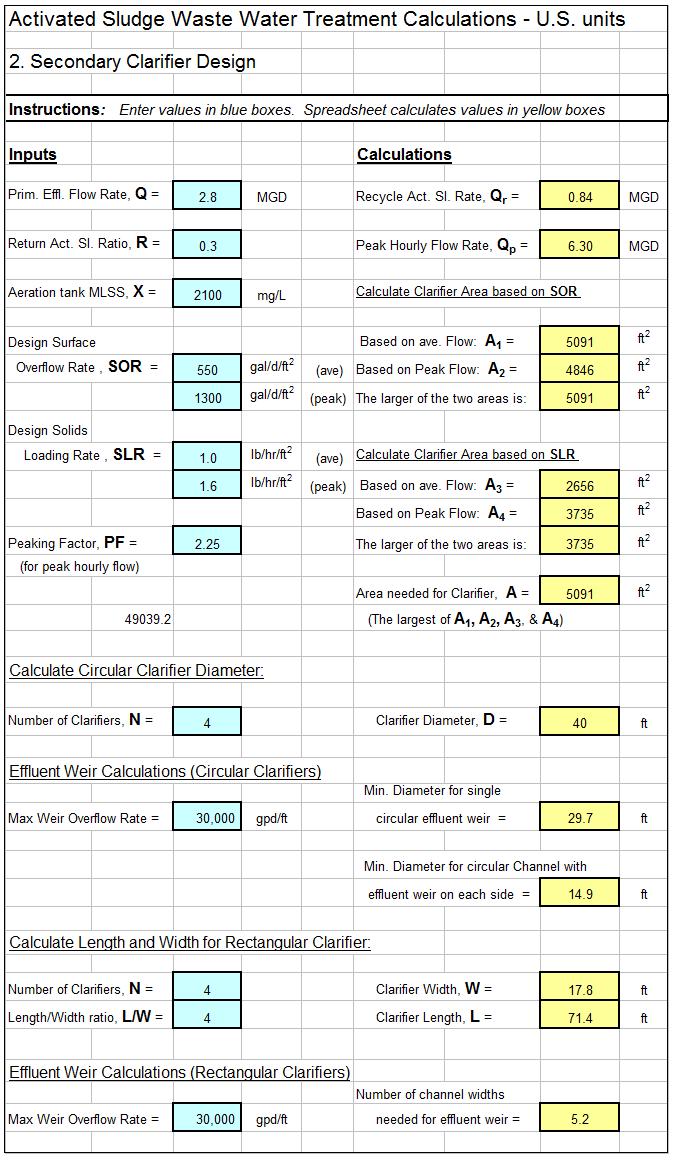
An Excel Spreadsheet as an Activated Sludge Secondary Clarifier Design Calculator

The Excel spreadsheet template shown below can be used to carry out the activated sludge secondary clarifier design calculations described above.   Why bother to make these calculations by hand?  This Excel spreadsheet can handle primary and secondary clarifier surface area calculations and determine diameter for circular clarifier(s) or length and width for rectangular clarifier(s) and is available in either U.S. or S.I. units at a very low cost (only $11.95)  in our spreadsheet store.  These spreadsheets also make weir overflow calculations to aid in effluent weir design.

screenshot of activated sludge secondary clarifier design spreadsheet

Reference

1. Metcalf & Eddy, Inc, (revised by Tchobanoglous, G, Burton, F.L., Stensel, H.D., Wastewater Engineering Treatment and Reuse, 4th Edition, New York, NY, 2003.


Detention Pond Routing Spreadsheet Calculations

Where to Find a Detention Pond Routing Spreadsheet

For detention pond routing spreadsheet to carry out routing calculations and plot inflow and outflow hydrographs, click here to visit our spreadsheet store.  Read on for information about the use of a storm water detention pond routing spreadsheet.


Overview Detention Pond Routing with a Spreadsheet

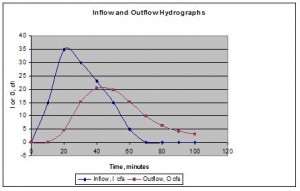
A detention pond routing spreadsheet is used to project an outflow hydrograph from a stormwater Inflow and Outflow Hydrographs from a Detention Pond Routing Spreadsheetdetention pond based on a given inflow hydrograph, stage-storage information for the pond, and stage-outflow information based on the outflow control device.  An output from the routing process is typically a plot of the inflow and outflow hydrographs similar to that shown at the right.  The outflow is often controlled by a rectangular weir, an orifice, and/or a pipe.  In some cases two-stage control is used with perhaps an orifice to provide outflow control for small storms and a weir to control the outflow rate from larger storms.  The routing process should be set up so that changes can be made in outflow control parameters and effects on the outflow hydrograph can then be observed.

Input Information Needed for a Detention Pond Routing Spreadsheet

In addition to an inflow hydrograph like that shown above, stage-storage and stage-outflow information is needed for a detention pond routing spreadsheet.  The stage-storage information would typically be in the form of a table, graph, or equation showing the pond volume, V, as a function of the pond depth, h.  The stage-outflow information is typically in the form of an equation for outflow, O, as a function of pond depth, h, based on the type of outflow control device, as described in the next section.

Stage-Outflow Equations for a detention pond routing spreadsheet

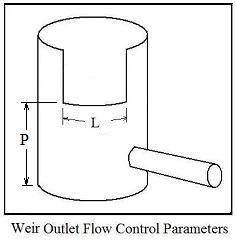
Detention Pond Routing Spreadsheet Weir Outlet DiagramA rectangular weir is one possible outflow control device, often in a riser as shown in the diagram at the left.  The equation for pond outflow  is:     O = CdL(h – P)1.5 where the parameters in the equation are as follow:

  • O = pond outflow = discharge over the rectangular weir in cfs for U.S. units (m3/s for S.I. units)
  • Cd = the discharge coefficient for the weir.  Typical value for U.S. units is 3.3 (1.84 for S.I. units)
  • L = weir length in ft for U.S. units (m for S.I. units)
  • h = stage (depth of water in pond) in ft for U.S. units (m for S.I. units)
  • P = height of weir crest above pond bottom in ft for U.S. units (m for S.I. units)

Equations like this are also available for an orifice outlet, two stage outlet, and pipe outlet.  These equations are given and used in the detention pond routing spreadsheet in either S.I. units or U.S. units in  our spreadsheet store.

The Storage Indication Routing Equation for Detention Pond Routing Spreadsheet Calculations

In addition to the input information described above, a routing equation is needed for a detention pond routing spreadsheet.  A commonly used routing equation is the Storage Indication Equation:

0.5(I1 + I2 )Δt  +  (S1 – 0.5O1Δt)  =  (S2 + 0.5O2Δt) Where:

  • Δt is the time interval used for the inflow and outflow hydrographs in minutes
  • I1 and I2 are successive values of the inflow from the inflow hydrograph (cfs – U.S. or m3/s – S.I.)
  • S1 is the initial value of pond storage (pond volume at the beginning of the storm in cfs – U.S. or m3/s – S.I.)
  • O1 is the initial outflow rate at the beginning of the storm in ft3 – U.S. or m3 – S.I.)
  • S2 and O2 are the pond storage and outflow respectively at time Δt after the beginning of the storm in the same units shown above.

For a given inflow hydrograph, I1, I2 , and all subsequent values of inflow for the duration of the storm are known.  Thus if the initial pond volume, S1, and initial pond outflow, O1, are known, then all of the parameters on the left hand side of the equation are known so the value of the right hand side of the equation (S2 + 0.5O2Δt) can be determined.

Now comes the elegant part of the storage indication routing procedure.  As described above S vs h and O vs h must be available, in the form of tables, graphs or equations.  Thus for any value of h, the parameter, S + 0.5OΔt can be determined and values of S and O can be determined for a known value of S + 0.5OΔt.  Thus, by stepwise calculations in a detention pond routing spreadsheet, the outflow hydrograph (O vs t) can be obtained.

An Excel Spreadsheet as a Pond Routing Calculator

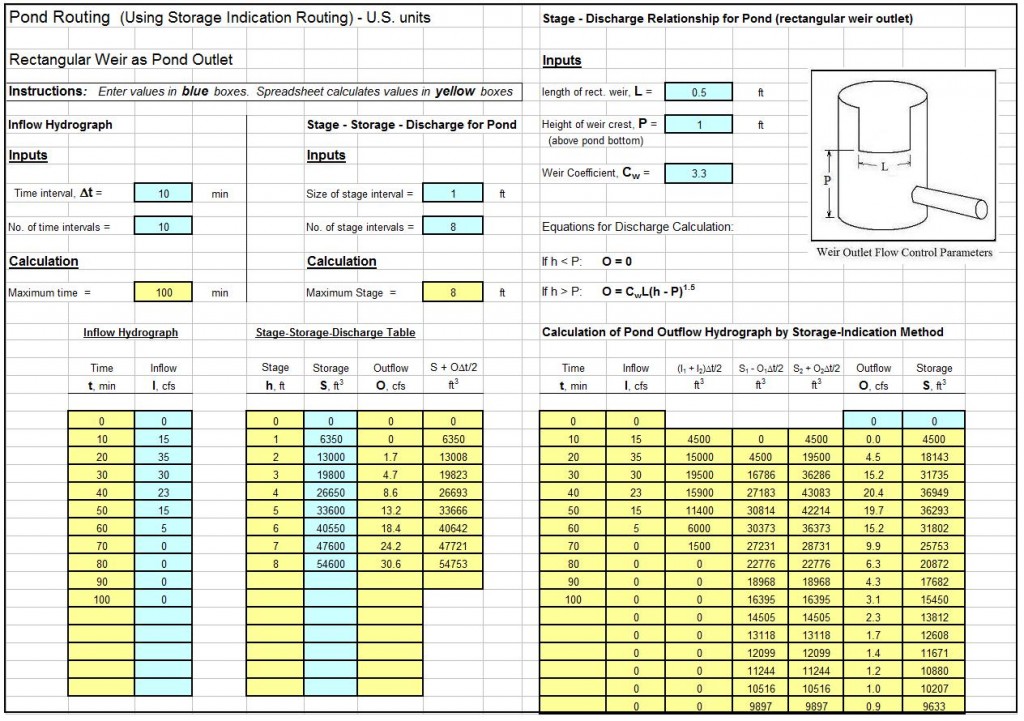
The template shown below is a  detention pond routing spreadsheet to carry out the procedure described above.   Why bother to make these calculations by hand?  This Excel spreadsheet can handle rectangular weir, orifice, two-stage (orifice/weir), pipe outflow control, and two-stage (pipe/weir), and is available in either U.S. or S.I. units at a very low cost in our spreadsheet store.  These spreadsheets also generates a table and graph showing the inflow and outflow hydrographs for a given set of input parameters.

screenshot of a detention pond routing spreadsheet

References

1. McCuen, Richard H., Hydrologic Analysis and Design, 2nd Ed, Upper Saddle River, NJ, 1998.


Minimum Pipe Wall Thickness Calculator Excel Spreadsheet

Where to Find a Minimum Pipe Wall Thickness Calculator Spreadsheet

For an Excel spreadsheet to use as a minimum pipe wall thickness calculator, click here to visit our spreadsheet store.  Read on for information about the use of an Excel spreadsheet as a minimum pipe wall thickness calculator.

The Barlow Formula for a Minimum Pipe Wall Thickness Calculator

The classic Barlow formula for calculating bursting pressure for a pipe is:

P = 2S*T/Do where:

  • Do is the outside diameter of the pipe with units of inches (U.S.) or mm (S.I.)
  • S is the strength of the pipe material with units of psi (U.S.) or N/mm2 (S.I.)
  • T is the wall thickness with units of inches (U.S.) or mm (S.I.)
  • P is the fluid pressure in the pipe with units of psi (U.S.) or MPa (S.I.)

If the ultimate tensile strength of the pipe material is used for S, then P will be the bursting pressure, while P will be the pressure at which permanent deformation of the pipe begins if S is the yield strength of the material.

The Barlow formula can be rearranged to: T = /Do*P/2S to use in a minimum pipe wall thickness calculator for the pipe wall thickness for a given bursting pressure or deformation pressure.

Calculation of Maximum Pipe Operating Pressure

The Barlow formula can be modified to calculate the maximum fluid operating pressure for a given pipe wall thickness and pipe diameter, by incorporation of a safety factor and corrosion allowance as follows:

P = 2S*(T – Tc)/SF*Do

where  SF is a safety factor (dimensionless) and Tc is a corrosion allowance in inches (U.S.) or mm (S.I.).  This equation uses the outside pipe diameter in the calculations, which is convenient, because the outside pipe diameter remains the same for all of the schedules (wall thicknesses) for a given nominal pipe size.  The calculation can be done using the outside pipe diameter (Do) in an equation based on the inside pipe diameter, by using the relationship,  Di =  Do –  2T , to give the equation:

P = 2S*(T – Tc)/SF*(Do –  2T)

Use of Equations in a Minimum Pipe Wall Thickness Calculator

The last equation in the previous section can be rearranged to give a pipe wall thickness formula as follows:

T = (P* SF*Do + 2S*Tc)/(2S + 2P*SF)

An Excel Spreadsheet as a Minimum Pipe Wall Thickness Calculator

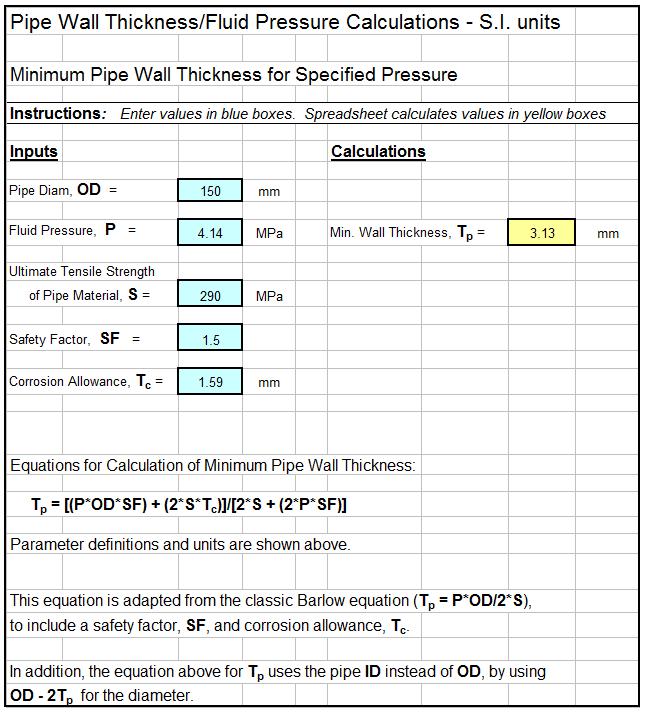
The Excel spreadsheet template shown below can be used as a minimum pipe wall thickness calculator or to calculate the maximum operating pressure in a pipe if the necessary other parameters are known/specified.   Why bother to make these calculations by hand?  This Excel spreadsheet and others for pipe flow calculations are available in either U.S. or S.I. units at a very low cost in our spreadsheet store.

Minimum Pipe Wall Thickness Calculator Spreadsheet


Natural Convection Heat Transfer Coefficient Calculator Spreadsheet

Where to Find a Natural Convection Heat Transfer Coefficient Calculator Spreadsheet

For an Excel spreadsheet to use as a natural convection heat transfer coefficient calculatorclick here to visit our spreadsheet store.  Why search for heat transfer coefficient correlations or use online calculators, when you can buy a spreadsheet to use as a natural convection heat transfer coefficient calculator for five different configurations for only $14.95. Read on for information about natural convection heat transfer coefficients and Excel spreadsheets to obtain a value for them.

Convection heat transfer takes place between a solid surface and fluid that is at a different temperature and is in contact with the surface.  If the fluid is flowing past the surface due to an external driving force like a fan or pump, then the heat transfer is called forced convection.  When  fluid motion is due to density differences within the fluid (caused by temperature variation), then the heat transfer is called natural convection or free convection.

Newton’s Law of Cooling for Natural Convection Heat Transfer Coefficient Calculator

Newton’s Law of Cooling [ Q = hA(Ts – Tf) ] is a simple expression used for the rate of convective heat transfer with either forced or natural convection.  The parameters in Newton’s Law of Cooling are:

  • Q, the rate of forced convection heat transfer (Btu/hr – U.S. or W – S.I.)
  • Ts, the solid temperature (oF – U.S. or oC – S.I.)
  • Tf, the fluid temperature (oF – U.S. or oC – S.I.)
  • A, the area of the surface that is in contact with the fluid (ft2 – U.S. or m2 – S.I.)
  • h, the convective heat transfer coefficient (Btu/hr-ft2oF – U.S. or W/m2-K – S.I.)

Dimensionless Nusselt, Rayleigh, Grashof, and Prandtl Numbers

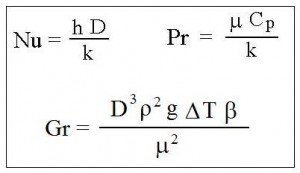
natural convection heat transfer coefficient calculator dimensionless numbersA natural convection heat transfer coefficient calculator typically makes estimations using correlations of dimensionless numbers, specifically correlations of Nusselt number (Nu) with Prandtl number (Pr), Grashof number (Gr), and/or Rayleigh number (Ra), where Ra = GrPr.  The Nusselt, Grashof and Prandtl numbers are defined in the box at the left.

Following is a list of the parameters that appear in these dimensionless numbers, with units are given for both the U.S engineering system and S.I. system of units:

  • D, a characteristic length parameter (e.g. diameter for natural convection from a circular cylinder or a sphere or height of a vertical plate)  (ft for U.S.,  m for S.I.)
  • ρ, the density of the fluid  (slugs/ft3 for U.S.,  Kg/m3 for S.I.)
  • μ, the viscosity of the fluid  (lb-sec/ft2 for U.S.,  N-s/m2 for S.I.)
  • k, the thermal conductivity of the fluid  (Btu/hr-ft-oF for U.S.,  W/m-K for S.I.)
  • Cp, the heat capacity of the fluid  (Btu/lb-oF for U.S.,  J/kg-K for S.I.)
  • g, the acceleration due to gravity (32.17 ft/sec2 for U.S.,  9.81 m/s2 for S.I.)
  • β, the coefficient of volume expansion of the fluid  ( oR for U.S.,  K for S.I.)
  • ΔT, the temperature difference between the solid surface and the fluid  ( oF for U.S., oC or K for S.I.)

The following sections provide equations for estimating the heat transfer coefficient for several common natural convection configurations.

Natural Convection Heat Transfer Calculator for a Vertical Plane

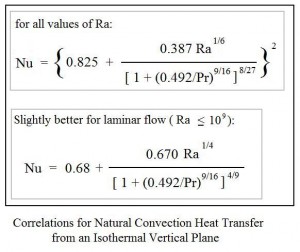
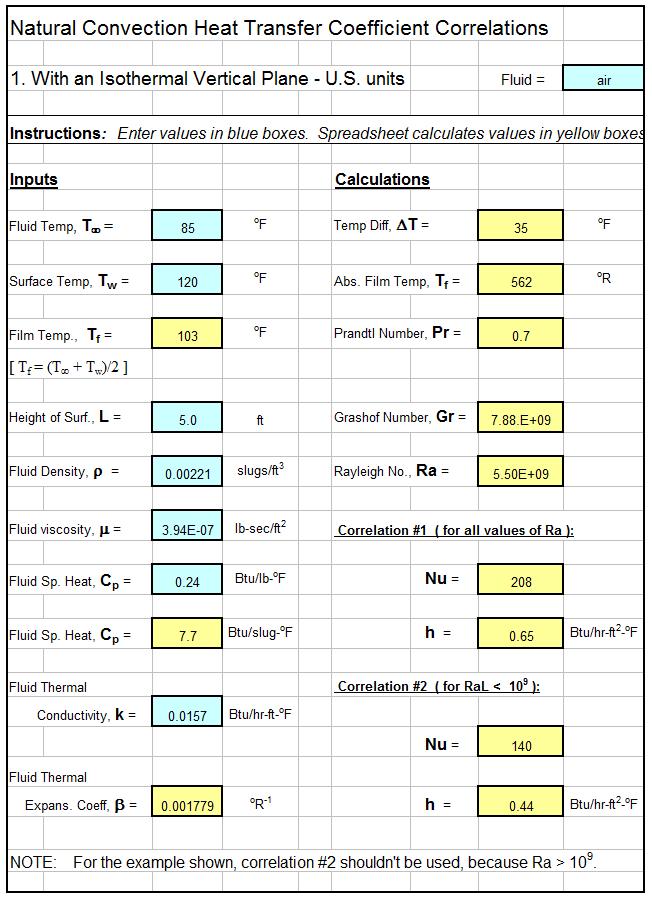
natural convection heat transfer coefficient calculator correlationsThe box at the right shows two correlations for convection heat transfer between a vertical plane and a fluid of different temperature in contact with it.  The first can be used for all values of Rayleigh number and the second is only for laminar flow, indicated by Ra < 109.  The screenshot image below shows an example of an Excel spreadsheet to use as a natural convection heat transfer coefficient calculator for a vertical plate using the two equations shown here.

An Excel Spreadsheet as a Natural Convection Heat Transfer Calculator

For low cost, easy to use Excel spreadsheet packages to use as a natural convection heat transfer coefficient calculator for natural convection from a vertical plane, a horizontal plane, an inclined plane, a horizontal cylinder or a sphere in either U.S. or S.I. units (for only $16.95),  click here to visit our spreadsheet store.

Screenshot of a natural convection heat transfer coefficient calculator spreadsheet

References

1. Incropera, F.P., DeWitt, D.P, Bergman, T.L., & Lavine, A.S., Fundamentals of Heat and Mass Transfer, 6th Ed., Hoboken, NJ, John Wiley & Sons, (2007).

2. Lienhard, J.H, IV and Lienhard, J.H. V, A Heat Transfer Textbook: A Free Electronic Textbook

3. Bengtson, Harlan HFundamentals of Heat Transfer, an online continuing education course for engineering PDH credit

4. Bengtson, Harlan H., Convection Heat Transfer Coefficient Estimation, an online continuing education course for PDH credit.

Suppressed Rectangular Weir Calculations with Excel Spreadsheets

Introduction to Suppressed Rectangular Weir Calculations

For an Excel spreadsheet to make suppressed rectangular weir flow calculations, click here to visit our spreadsheet store.  Read on for information about Excel spreadsheets that can be used as suppressed rectangular weir open channel flow calculators.

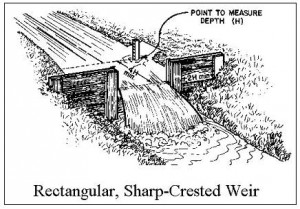
As shown in the diagrams and pictures below, the rectangular refers the the shape of the water cross-section as it goes over a sharp crested rectangular weir, which consists of a plate placed in an open channel so that the water is forced to flow through the rectangular open in the weir plate.  It can be used for open channel flow rate measurement, by measuring the height of water above the weir crest (the straight, level top of the weir opening), which can then be used to calculate the water flow rate over the weir.

Background on Sharp Crested Rectangular Weir Calculations in General

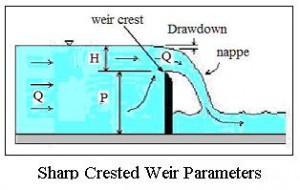
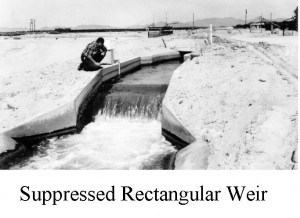
suppressed rectangular weir calculations imageThe picture at the left shows a rectangular weir measuring open channel flow rate in a natural channel.  The diagram below right shows a longitudinal cross-section of a sharp crested weir, with some of the terminology and parameters often used for sharp crested weirs included on the diagram.

The weir crest is the top of the weir. For a rectangular weir it is the straight, level suppressed rectangular wier calculatons longitudinal sectionbottom of the rectangular opening through which water flows over the weir. The term nappe is used for the sheet of water flowing over the weir. The equations for calculating flow rate over a weir in this article require free flow, which takes place when there is air under the nappe. The drawdown is shown in the diagram as the decrease in water level going over the weir due to the acceleration of the water.  The head over the weir is shown as H in the diagram; the height of the weir crest is shown as P; and the open channel flow rate in the open channel (and over the weir) is shown as Q.
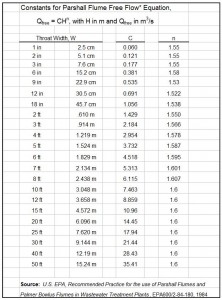
Image Credits:  Rectangular, Sharp-Crested Weir: flowmeterdirectory.co.uk

Sharp Crested Weir Parameters:  H. H. Bengtson, Ref #2

The Francis Equation for Suppressed Rectangular Weir Calculations

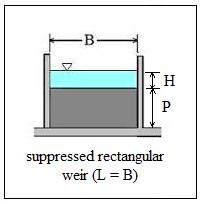
suppressed rectangular weir calculations pictureA suppressed rectangular weir is one for which the weir extends across the entire channel, so that the length of the weir, L, is the same as the width of the channel, B.  The picture at the left shows a suppressed rectangular weir being used to measure the flow of water in an open channel.  The diagram below right shows some of the key parameters used in suppressed rectangular weir flow rate calculations.  Specifically, the suppressed rectangular weir imageheight of the weir crest, P, the head over the weir, H, and the weir length, L (equal to channel width, B) are shown on the diagram.  The U.S. Bureau of Reclamation, in their Water Measurement Manual (Ref #1 below), recommend the use of the Francis equation (shown below) for suppressed rectangular weirs, subject to the condition that  H/P < 0.33 and H/B < 0.33:

For U.S. units: Q = 3.33 B H3/2, where

  • Q is the water flow rate in ft3/sec,
  • B is the length of the weir (and the channel width) in ft, and
  • H is the head over the weir in ft.

For S.I. units:  Q = 1.84 B H3/2, where

  • Q is the water flow rate in m3/sec,
  • B is the length of the weir (and the channel width) in m, and
  • H is the head over the weir in m.

The same condition for H/P and H/B apply.

Image Credits:  Suppressed Rectangular Weir Picture – U.S. Dept. of the Interior, Bureau of Reclamation, 2001 revised, 1997 third edition, Water Measurement Manual.

Suppressed Rectangular Weir Diagram – Bengtson, Harlan H.

The Kindsvater-Carter Formula for Suppressed Rectangular Weir Calculations

If either of the requirements in the previous section (H/P < 0.33 and H/B < 0.33) are not met the the more general Kindsvater- Carter Equation, shown below should be used.

U.S. units: Q = [0.075(H/P) + 0.602](2/3)[(2g)1/2](L – 0.003)(H + 0.003)3/2

S.I. units: Q = [0.075(H/P) + 0.602](2/3)[(2g)1/2](L – 0.001)(H + 0.001)3/2

Note that if H/P < 0.33 and H/B < 0.33, then the Francis Equation and the Kindsvater-Carter Equation will give nearly the same value for Q.  As H/P and/or H/B increase more and more above the 0.33 limit the calculations from the two equations will diverge more and more.  In these cases the value calculated by the Kindsvater-Carter formula should be used.

An Excel Spreadsheet for Suppressed Rectangular Weir Calculations

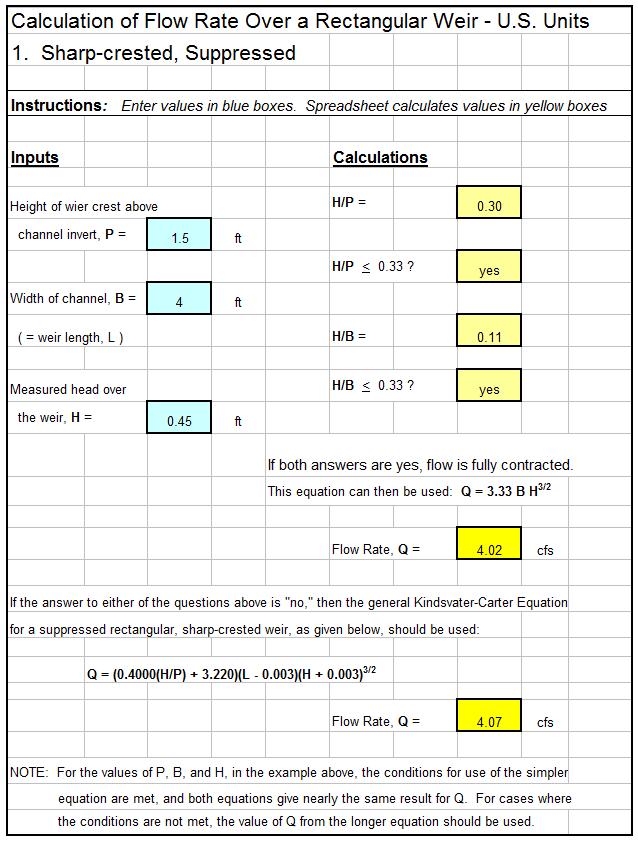
The Excel spreadsheet template shown below can be used for suppressed rectangular weir calculations, to calculate the water flow rate over a suppressed rectangular weir, using both the Francis equation and the Kindsvater-Carter equation.  Only three input values are needed.  They are the height of the weir crest above the channel invert, P; the width of the channel, B (which equals the weir length L); and the measured head over the weir, H. With these three input values, the Excel formulas will calculate H/P and H/B. If both of these are less than 0.33, then the value of Q calculated with the Francis equation can be used.  If either of the conditions aren’t met, then the value of Q calculated with the Kindsvater-Carter formula should be chosen.  This Excel spreadsheet and others for suppressed and contracted rectangular weir calculations are available in either U.S. or S.I. units at a very low cost in our spreadsheet store.

suppressed rectangular wier calculations spreadsheet screenshot

References

1. U.S. Dept. of the Interior, Bureau of Reclamation, 2001 revised, 1997, 3rd ed,  Water Measurement Manual

2. Bengtson, H.H., Sharp Crested Weirs for Open Channel Flow Measurement, an Amazon Kindle ebook.

3. Bengtson, H.H., Open Channel Flow Measurement – Weirs and Flumes, An online continuing education course for PDH credit for Professional Engineers

4. Bengtson, H. H., Sharp-Crested Weirs for Open Channel Flow Measurement, An online continuing education course for PDH credit for Professional Engineers.

5. Bengtson, H.H., “A Sharp Crested Rectangular Weir Equations Spreadsheet,” an online blog article.

6. Merkley, Gary P., Weirs for Flow Measurement Open Course Ware, Utah State University.

Parshall Flume Discharge Calculation – Open Channel Flow Measurement with Excel

Where to find a Parshall Flume Discharge Calculation Spreadsheet

For a Parshall flume discharge calculation Excel spreadsheet to make open channel flow measurement calculations, click here to visit our spreadsheet store. Obtain a convenient, easy to use Parshall flume discharge calculation spreadsheet at a reasonable price.    Read on for information about Excel spreadsheets that can be used for Parshall flume/open channel flow measurement calculations.

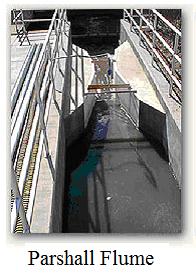
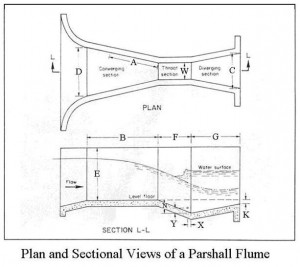
picture for parshall flume discharge calculation spreadsheetParshall flumes are used for a variety of open channel flow measurement.  They are especially good for flows containing suspended solids, as for example the flow in wastewater treatment.  As seen in the picture at the right, the plan view of a Parshall flume is similar to that of a venturi flume, with a converging section, a throat, and a diverging section.  A Parshall flume, however, also has prescribed variations in the channel bottom slope as shown in the diagram in the next section.  Flow rate through a Parshall flume can be calculated based on a measured head, using equations that will be discussed in a later section.  A Parshall flume must be constructed with prescribed dimensions as shown in the next section.

Image Credit:   City of Batavia, Illinois

Flume Configuration and Dimensions for Parshall Flume Discharge Calculations

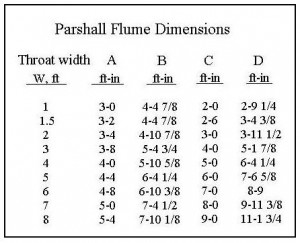
Plan and sectional view - parshall flume discharge calculationThe diagram at the left shows the general configuration of a Parshall flume with a plan and elevation view.  The width of the throat is typically used to specify the size of a Parshall flume.  The table at the right below, shows the standard dimensions for Parshall flumes with throat widths ranging from 1 ft to 8 ft.  Similar information is available for throat widths down to 1 inch and up to 50 ft.

Such a range of sizes covers a very wide range of flow rates.  A 1 inch flume will carry a flow of 0.03 cfs at 0.2 ft of head, while a 50 ft Parshall flume will carry 3,000 cfs at aParshall Flume Dimensions for Parshall Flume Discharge Calculation head of 5.7 ft.   For the range of throat widths in the table, the other dimensions in the diagram are constant at the following values:

E = 3′-0″,  F = 2′-0″,  G = 3′-0″,

K = 3 inches,  N = 9 inches,

X = 2 inches,  Y = 3′

Free Flow and Submerged Flow in Parshall Flume Discharge Calculation

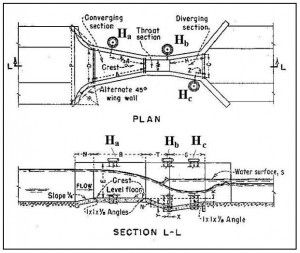
For “free flow” through a Parshall flume, the flow rate through the throat of the flume is unaffected by the downstream conditions.  For free flow, a hydraulic jump will be visible in the throat of the Parshall flume.  For flow situations where downstream conditions cause the flow to back up into the throat, the hydraulic jump isn’t visible, and the flow is said to be “submerged flow” rather than “free flow.”

The ratio between head measurements at the two locations, Ha and Hb, as shown in the diagram at the left above, can be used as a quantitative criterion to differentiate between free flow and submerged flow.  The values of Hb/Ha for free flow and for submerged flow, for several ranges of throat width from 1″ to 8′ are as follows:

For 1” < W < 3” : free flow for Hb/Ha < 0.5; submerged flow for Hb/Ha > 0.5

For 6” < W < 9” : free flow for Hb/Ha < 0.6; submerged flow for Hb/Ha > 0.6

For 1’ < W < 8’ : free flow for Hb/Ha < 0.7; submerged flow for Hb/Ha > 0.7

For 8’ < W < 50’ : free flow for Hb/Ha < 0.8; submerged flow for Hb/Ha > 0.8

Excel Formulas for Free Flow Parshall Flume Discharge Calculation

The free flow equation for Parshall flume discharge calculation is QfreeC Han, where

  • Qfree = the open channel flow rate through the Parshall flume under free flow conditions, cfs for U.S. units or  m3/s for S.I.
  • Ha = the head measured at the correct point in the converging section of the Parshall flume as described in the previous section,  ft for U.S. units or m for S.I. units
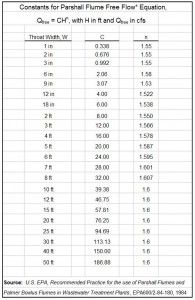
  • C and n are constants for a given Parshall flume throat width, W.

The tables below give the constants C and n in the equations for free flow Parshall flume discharge calculation for both U.S. units and for S.I. units.

constants for Parshall flume discharge calculation - U.S. unitsconstants for Parshall flume discharge calculation - S.I. units


free flow Parshall flume discharge calculation spreadsheet


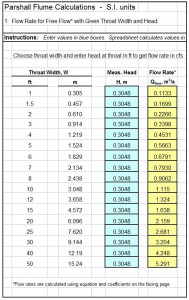
The screenshot at the right shows a Parshall flume discharge calculation spreadsheet that will calculate flow rate through the Parshall flume under free flow conditions in S.I. units for a selected throat width and a specified value for the measured head.   This Excel spreadsheet and one for submerged flow calculation are available in either U.S. or S.I. units at a very low cost in our spreadsheet store.


Excel Formulas for Submerged Flow Parshall Flume Discharge Calculation

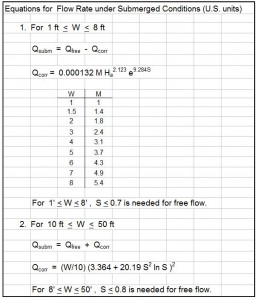
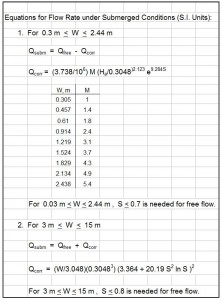
The submerged flow equations for Parshall flume discharge calculation, as used by the Excel formulas in the spreadsheet below, are summarized for U.S. units and for S.I. units in the diagrams below:

submerged flow equations for Parshall flume discharge calculation - U.S. unitssubmerged flow equations for Parshall flume discharge calculation - S.I. units


The primary submerged flow equation Parshall flume discharge calculation is:                QsubmQfree – Qcorr, where

  • Qsubm = the flow rate through the Parshall flume for a submerged flow condition, in cfs for U.S. units or  m3/s for S.I. units
  • Qfree =  the flow rate calculated with the equation, Qfree = C Han, as described in the previous section, in cfs for U.S. units or  m3/s for S.I. units
  • Qcorr is a flow correction factor calculated from the equations shown above for the correct throat width, W, in cfs for U.S. units or  m3/s for S.I. units

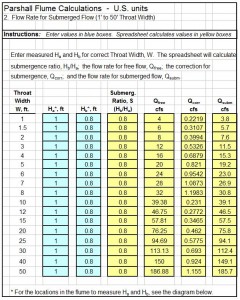
submerged flow Parshall flume discharge calculation spreadsheet


The screenshot of an Excel spreadsheet template shown at the left will carry out submerged flow Parshall flume discharge calculation in U.S. units for a selected throat width and a specified value for the measured heads, Ha and Hb.   This Excel spreadsheet and one for free flow calculation are available in either U.S. or S.I. units at a very low cost in our spreadsheet store.


References

1. U.S. EPA, Recommended Practice for the Use of Parshall Flume and Palmer Bowlus Flumes in Wastewater Treatment plants, EPA600/2-84-180, 1984

2. Wahl, Tony L., Equations for Computing Submerged Flow in Parshall Flumes, Bureau of Reclamation, Denver, Colorado, USA

3. U.S. Dept. of the Interior, Bureau of Reclamation, Water Measurement Manual, 2001 revised, 1997 third edition