Proportional Sutro Weir Design Calculation Excel Spreadsheet

Where to get a Proportional Sutro Weir Design Calculation Excel Spreadsheet

For a proportional sutro weir design calculation Excel spreadsheet in either U.S. or S.I. units, click here to visit our spreadsheet store.  Obtain convenient, easy to use spreadsheets for proportional sutro weir design calculations at reasonable prices. Read on for information about the use of a proportional sutro weir design calculation Excel spreadsheet.

Principles of a Proportional Sutro Weir Design Calculation Excel Spreadsheet

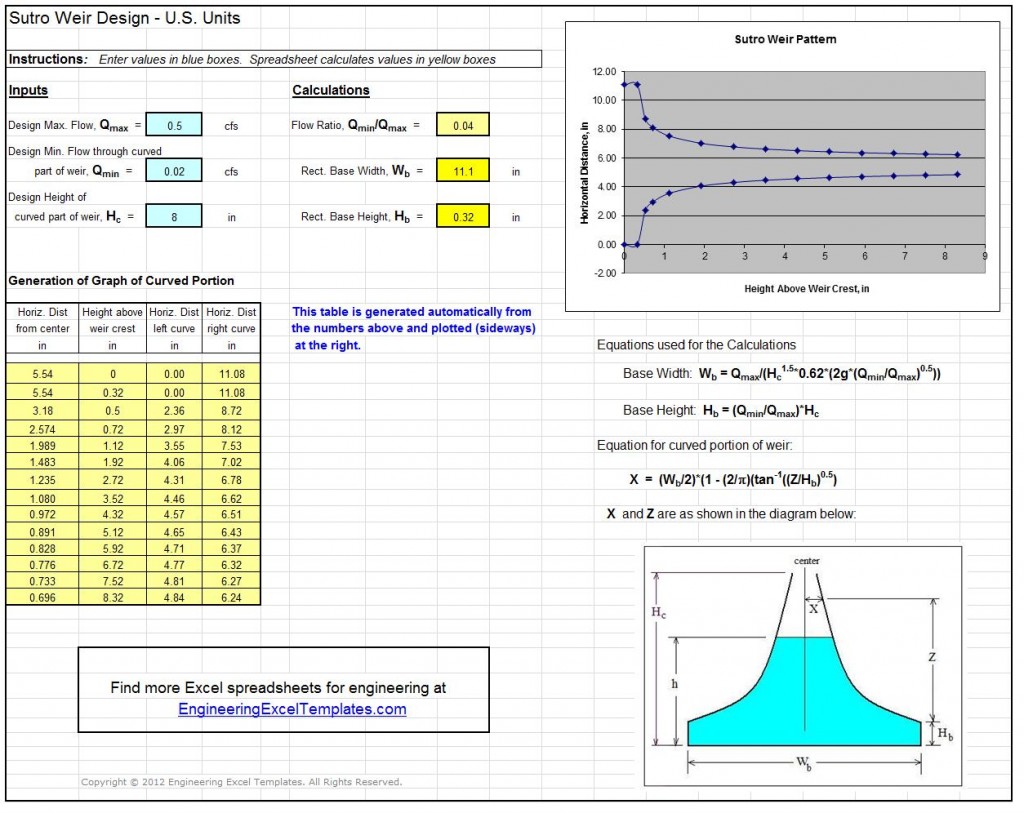
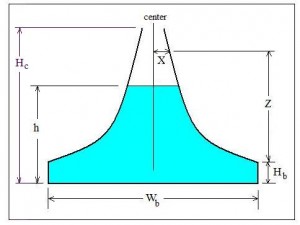
For the commonly used rectangular weir or V-notch weir, the flow rate over the weir Diagram for proportional sutro weir design calculation excel spreadsheetincreases as the head over the weir increases, but the flow rate increases at a faster rate than the head over the weir.  For some applications, it is desirable for the flow rate over a weir to be proportional to the head over the weir.  The sutro weir, also known as a proportional weir accomplishes this by having the width of the opening above the weir crest decrease with increasing head over the weir crest as shown in the diagram of a sutro weir at the right.  Equations that can be used for proportional sutro weir design are discussed in the next section.
Equations for Proportional Sutro Weir Design Calculation Excel Spreadsheet

Equations for the base width and base height of a sutro weir are as follows:

base height equation for proportional sutro weir design calculation Excel spreadsheet

base width equation for proportional sutro weir design calculation Excel spreadsheet

  • Wb  =  base width in ft (m for S.I. units)
  • Hb  =  base height in ft (m for S.I. units)
  • Hc  =  max height or curved portion of weir in ft (m for S.I. units)
  • Qmax  =  design maximum flow over the weir in cfs (m3/s for S.I. units)
  • Qmin  =  design minimum flow over the weir in cfs (m3/s for S.I. units)
  • g = acceleration of gravity = 32.17 ft/s/s (9.81 m/s/s for S.I. units)

The equation for the curved portion of a proportional sutro weir is:

Curve Equation for proportional sutro weir design calculation Excel spreadsheet

X and Z are position parameters as shown in the diagram above.  They will have the same units as Wb .

A Screenshot for a Proportional Sutro Weir Design Calculation Excel Spreadsheet

For a proportional sutro weir design calculation Excel spreadsheet with calculations in S.I. or U.S. units, or for other spreadsheets for open channel flow measurement calculations, see: www.engineeringexceltemplates.com

The Excel spreadsheet screenshot below shows part of a spreadsheet for proportional sutro weir design calculations, available  at our spreadsheet store in either U.S. or S.I. units at a very reasonable price.

 Screenshot of Proportional Sutro Weir Design Calculation Excel Spreadsheet

Reference

1, U.S. DOT, Fed Highway Admin, Urban Design Manual, Circular No. 22, 2nd Ed. 2001  (Publ. No. FHWA-NHI-010021-HEC-22)

2. Bengtson, Harlan H., Proportional Weir Design Equations,” an online blog article

Wastewater Lagoon Design Spreadsheets

Where to get Wastewater Lagoon Design Spreadsheets

For wastewater lagoon design spreadsheets in either U.S. or S.I. units, click here to visit our spreadsheet store.  Obtain convenient, easy to use spreadsheets for wastewater lagoon design calculations at reasonable prices. Read on for information about the use of Excel spreadsheets for wastewater lagoon design.  Three types of wastewater lagoons that will be discussed next are the anaerobic lagoon, the facultative lagoon, and the maturation pond.

Anaerobic Wastewater Lagoon Design

Anaerobic lagoons are most useful for incoming wastewater with a high BOD content.  If present, an anaerobic lagoon would typically be the first type of treatment, often followed by facultative and or maturation ponds.  Anaerobic lagoons are deeper than facultative or maturation ponds, usually 8 to 15 ft.  Anaerobic wastewater lagoon Design is usually based on volumetric loading (kg BOD/day/m3 or  lb BOD/day/1000 ft3).  A specified minimum hydraulic retention time may also be used.

Facultative Wastewater Lagoon Design

The classic type wastewater treatment lagoon is the facultative pond.  It is aerobic at the  top with an anaerobic sediment layer at the bottom.  Algae growing in the lagoon are important for maintaining dissolved oxygen in the pond.  There are often one or more primary facultative ponds and one or more secondary ponds.  A typical three cell layout for two primary cells and one secondary cell is shown in the diagram below.  A well designed and operated facultative lagoon system can provide secondary level treatment if algae are removed from the effluent.  Facultative wastewater lagoon design is typically based on surface loading (kg BOD/day/ha or lb BOD/day/acre).  A specified minimum hydraulic detention time is often used as a design factor also.Wastewater Lagoon Design - Three Cell Layout

Maturation Wastewater Lagoon Design

A maturation pond will typically be the last type of pond in a wastewater lagoon system if it is present.  There is usually little additional BOD removal in a maturation pond.  Its primary function is disinfection/reduction in bacterial content.  Maturation pond design is often based on required reduction in coliform bacteria with perhaps a minimum hydraulic retention time.

A Screenshot for a Wastewater Lagoon Design Spreadsheet

For a wastewater lagoon design spreadsheet with calculations in S.I. or U.S. units, or for other spreadsheets for activated sludge wastewater treatment calculations, see: www.engineeringexceltemplates.com

The Excel spreadsheet screenshot below shows part of a spreadsheet for wastewater lagoon design calculations, available  at our spreadsheet store in either U.S. or S.I. units at a very reasonable price.

Screenshot of wastewater lagoon design spreadsheet

References

1.  USEPA, Principles of Design and Operations of Wastewater Treatment Pond Systems for Plant Operators, Engineers, and Managers, EPA/600/R-11/088, August 2011.

2. Mara, D. & Pearson, H., Design Manual for Waste Stabilization Ponds in Mediterranean Countries, Lagoon Technology International Ltd, 1998.


Pipe Culvert Design Spreadsheet Calculations

Where to get a circular pipe culvert design spreadsheet

For pipe culvert design spreadsheets in either U.S. or S.I. units, click here to visit our spreadsheet store.  Obtain convenient, easy to use spreadsheets for culvert design calculations at reasonable prices. Read on for information about the use of Excel spreadsheets for circular culvert design.

Inlet Control and Outlet Control for a Pipe Culvert Design Spreadsheet

One of the general conditions for pipe culvert design calculations is inlet control, in which the flow rate through the culvert is controlled at the inlet end of the culvert by the culvert diameter and other inlet conditions.  The other general condition is outlet control, in which the flow rate is controlled by the outlet conditions and the entire length of the culvert.

Pipe Culvert Inlet Control Design Spreadsheet Calculations

An equation that relates culvert parameters for inlet control conditions in a pipe culvert design spreadsheet is:

Culvert Design Equation for Inlet Control Conditionswhere:

  • HW = headwater depth above inlet invert (ft – U.S. or m – S.I.)
  • D = inside height of the culvert (ft – U.S. or m – S.I.)
  • Q = discharge (cfs – U.S. or m3/s – S.I.)
  • A = cross-sectional area of culvert (ft2 – U.S. or m2 – S.I.)
  • S = culvert slope (dimensionless)
  • K1 = 1.0 for U.S. units or 1.811 for S.I. units
  • Ks = slope constant = -0.5 for a non-mitered or + 0.7 for a mitered inlet
  • Y and c are constants dependent on the type of culvert and type of inlet.

Pipe Culvert Outlet Control Design Calculations

An equation that relates culvert parameters for outlet control conditions in a pipe culvert design spreadsheet is:

Head Loss Equation for Outlet Control Culvert DesignWhere:

  • hL = the head loss in the culvert barrel for full pipe flow (ft – U.S. or m – S.I.)
  • Ku = 29 for U.S. units or 19.63 for S.I. units
  • n = Manning roughness coefficient for the culvert material
  • L = length of the culvert barrel (ft – U.S. or m – S.I.)
  • R = hydraulic radius of the full culvert barrel = A/P (ft – U.S. or m – S.I.)
  • A = cross-sectional area of the culvert barrel (ft2 – U.S. or m2 – S.I.)
  • P = perimeter of the culvert barrel, ft or m
  • V = velocity in the culvert barrel, ft/sec or m/s
  • Ke = loss coefficient for pipe entrance

A spreadsheet screenshot for pipe culvert design calculations


The Excel spreadsheet screenshot below shows part of a spreadsheet for circular culvert design calculations based on inlet control.   Based on the indicated input values, the spreadsheet will calculate the minimum required pipe culvert diameter and the headwater depth for the next larger standard culvert diameter.

For low cost, easy to use spreadsheets to make these calculations in S.I. or U.S. units, click here to visit our spreadsheet store.

screenshot for pipe culvert design spreadsheet

References

1.  Hydraulic Design of Highway Culverts,Third Edition,  Publication No. FHWA-HIF-12-026, U.S. DOT/Federal Highway Administration, April, 2012.

2. Bengtson, Harlan H., “Spreadsheets for Circular Culvert Design.”, an online article.

Hydraulic Jump Calculator Excel Spreadsheets

Where to Find Hydraulic Jump Calculator Excel Spreadsheets

For an Excel spreadsheets to use as an open channel flow, hydraulic jump calculatorclick here to visit our spreadsheet store.  Obtain a convenient, easy to use rectangular channel hydraulic jump calculator spreadsheet for only $14.95. Read on for information about the use of an Excel spreadsheet as a horizontal, rectangular channel hydraulic jump calculator.

Background for Hydraulic Jump Calculator

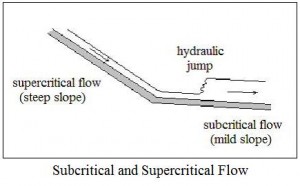
In order to discuss hydraulic jumps it’s necessary to talk about subcritical and supercritical flow.  In general subcritical flow takes place at low velocities and high flow depths, while supercritical flow occurs at high velocities and low flow depths.  For more details about critical, subcritical, and supercritical flow, see the article, “Open Channel Flow Spreadsheets – Critical Depth and Critical Slope.”  The diagram above shows supercritical flow on a steep slope, changing to subcritical flow on a mild slope.  As shown, the transition from supercritical flow to subcritical flow takes place with a hydraulic jump.  Whenever supercritical flow takes place on a slope that isn’t steep enough to maintain supercritical flow, the transition to subcritical flow will take place through the mechanism of a hydraulic jump as illustrated in the diagram.

Hydraulic Jump Calculator Parameters

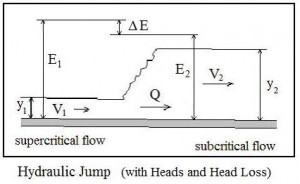
Hydraulic jump calculations center on relationships among the supercritical conditions before the jump (upstream or initial conditions) and the subcritical conditions after the jump (downstream or sequent conditions).  The diagram at the left shows initial supercritical parameters and sequent subcritical parameters for a hydraulic jump.  The parameters and their typical units are summarized below:

  • y1 = the initial (upstream) depth of flow in ft for U.S. or m for S.I. units
  • V1 = the initial (upstream) liquid velocity in ft/sec for U.S. or m/s for S.I. units
  • E1 = the initial (upstream) head in ft for U.S. or m for S.I. units
  • y2 = the sequent (downstream) depth of flow in ft for U.S. or m for S.I. units
  • V2 = the sequent (downstream) liquid velocity in ft/sec for U.S. or m/s for S.I. units
  • E2 = the sequent (downstream) head in ft for U.S. or m for S.I. units
  • Q = the flow rate through the hydraulic jump in cfs for U.S. or m3/s for S.I. units
  • ΔE = the head loss across the hydraulic jump in ft for U.S. or m for S.I. units

An Excel Spreadsheet as a Hydraulic Jump Calculator

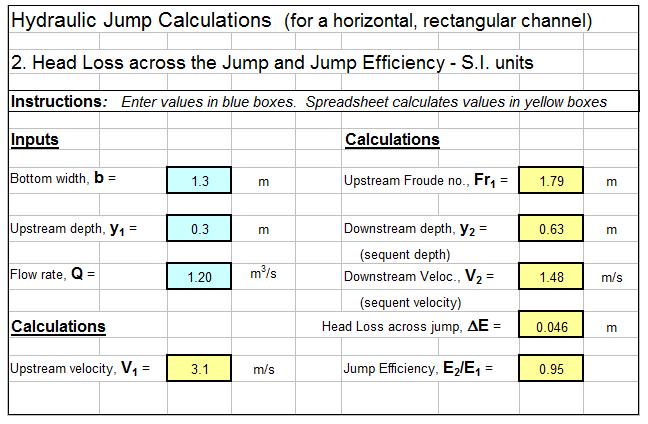
The Excel spreadsheet template shown below can be used to carry out hydraulic jump calculations.   Why bother to make these calculations by hand?  This Excel spreadsheet can calculate the sequent depth, sequent velocity, jump length, head loss across the jump, and hydraulic jump efficiency for specified initial depth, flow rate and channel width.  These spreadsheets are available in either U.S. or S.I. units at a very low cost (only $14.95 in our spreadsheet store.  These spreadsheets also have a tab for calculation of flow rate under a sluice gate and all of the equations used in the spreadsheet calculations are shown on the spreadsheets.

Note that some of the equations used in the spreadsheet calculations apply only for rectangular, horizontal channels, so the spreadsheets should be used only for channels that are at least approximately rectangular in cross-section and have a zero or very small slope.

References

1. Harlan H. Bengtson, “Hydraulic Jumps and Supercritical and Nonuniform Open Channel Flow,”  an online continuing education course for Professional Engineers.

2.  U.S. Department of Transportation, FHWA, Hydraulic Design of Energy Dissipators for Culverts and Channels, Hydraulic Engineering Circular No. 14, 3rd Ed, Chapter 6: Hydraulic Jump.

Activated Sludge Secondary Clarifier Design Spreadsheets

Where to Find Activated Sludge Secondary Clarifier Design Spreadsheets

For an Excel spreadsheet for activated sludge secondary clarifier design calculations, click here to visit our spreadsheet store.  Obtain a convenient, easy to use primary and secondary clarifier design spreadsheets for only $11.95.  Read on for information about the use of an Excel spreadsheet for activated sludge secondary clarifier design calculations.

Activated Sludge Secondary Clarifier Design Parameters

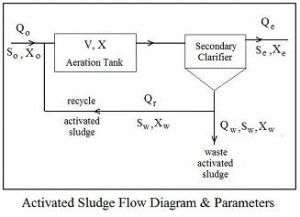
Flow Diagram for Activated Sludge Secondary Clarifier DesignThe parameters typically used for activated sludge secondary clarifier design are the surface overflow rate (SOR), solids loading rate (SLR), and weir overflow rate (WOR).  Activated sludge parameters are shown in the flow diagram at the right.  The equations defining these three parameters are:

SOR = Qo/A,  SLR = (Qo + Qr)X/A, and  WOR = Qo/L,  where:

  • Qo = primary effluent flow rate in MGD (U.S.) or m3/d (S.I.)
  • A = total surface area for secondary clarifier(s) in ft2 (U.S.) or m2 (S.I.)
  • Qr = recycle activated sludge flow rate in MGD (U.S.) or m3/d (S.I.)
  • X = mixed liquor activated sludge solids concentration in mg/L (U.S. or S.I.)
  • L = length of secondary clarifier effluent weir in ft (U.S.) or m (S.I.)

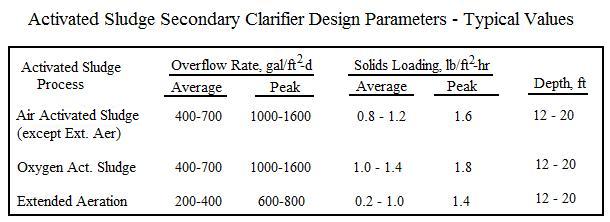
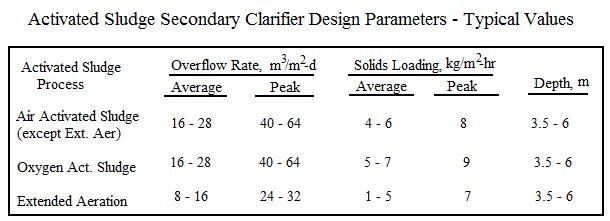
Typical values of surface overflow rate and solids overflow rate for activated sludge secondary clarifier design are shown in the tables below:

Design Parameters for Activated Sludge Secondary Clarifier Design

Activated Sludge Secondary Clarifier Design Parameters

Calculation of Activated Sludge Secondary Clarifier Surface Area

The equation for calculating the needed activated sludge secondary clarifier surface area from a design SOR value with units as shown above is:  A = Qo*106/SOR

The formula for calculating activated sludge secondary clarifier surface area from a design value of SLR with parameter units as shown above is:  A = (Qo + Qr)*8.34*X/SLR

An Excel Spreadsheet as an Activated Sludge Secondary Clarifier Design Calculator

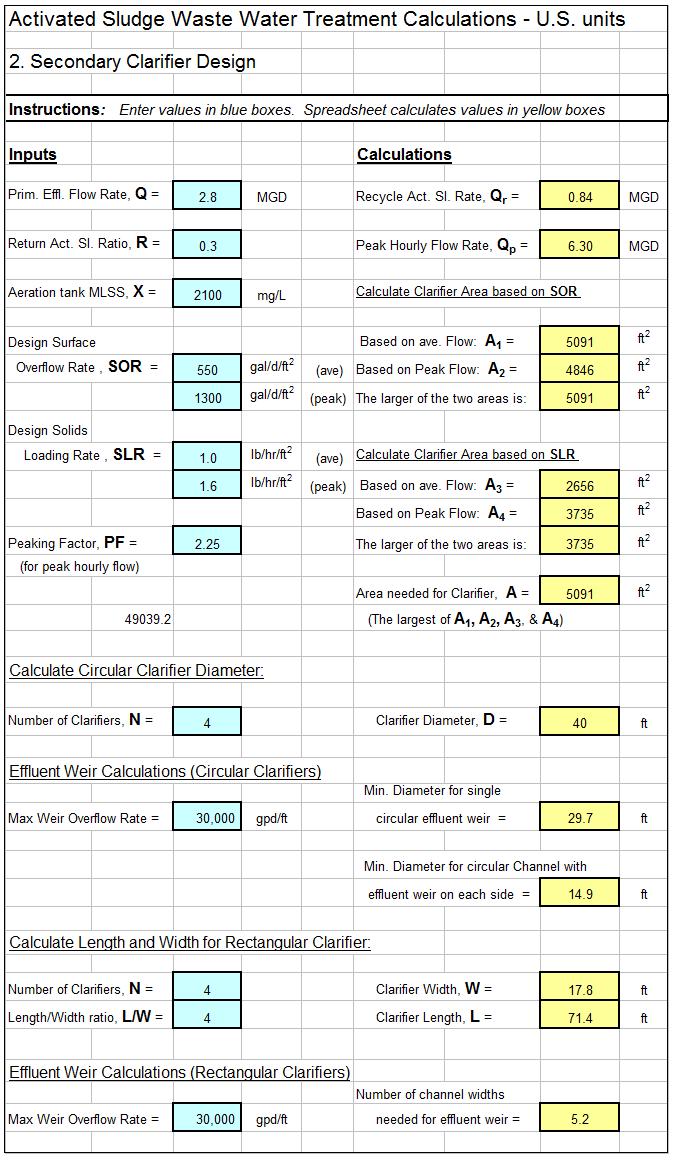
The Excel spreadsheet template shown below can be used to carry out the activated sludge secondary clarifier design calculations described above.   Why bother to make these calculations by hand?  This Excel spreadsheet can handle primary and secondary clarifier surface area calculations and determine diameter for circular clarifier(s) or length and width for rectangular clarifier(s) and is available in either U.S. or S.I. units at a very low cost (only $11.95)  in our spreadsheet store.  These spreadsheets also make weir overflow calculations to aid in effluent weir design.

screenshot of activated sludge secondary clarifier design spreadsheet

Reference

1. Metcalf & Eddy, Inc, (revised by Tchobanoglous, G, Burton, F.L., Stensel, H.D., Wastewater Engineering Treatment and Reuse, 4th Edition, New York, NY, 2003.


Detention Pond Routing Spreadsheet Calculations

Where to Find a Detention Pond Routing Spreadsheet

For detention pond routing spreadsheet to carry out routing calculations and plot inflow and outflow hydrographs, click here to visit our spreadsheet store.  Read on for information about the use of a storm water detention pond routing spreadsheet.


Overview Detention Pond Routing with a Spreadsheet

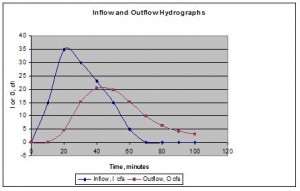
A detention pond routing spreadsheet is used to project an outflow hydrograph from a stormwater Inflow and Outflow Hydrographs from a Detention Pond Routing Spreadsheetdetention pond based on a given inflow hydrograph, stage-storage information for the pond, and stage-outflow information based on the outflow control device.  An output from the routing process is typically a plot of the inflow and outflow hydrographs similar to that shown at the right.  The outflow is often controlled by a rectangular weir, an orifice, and/or a pipe.  In some cases two-stage control is used with perhaps an orifice to provide outflow control for small storms and a weir to control the outflow rate from larger storms.  The routing process should be set up so that changes can be made in outflow control parameters and effects on the outflow hydrograph can then be observed.

Input Information Needed for a Detention Pond Routing Spreadsheet

In addition to an inflow hydrograph like that shown above, stage-storage and stage-outflow information is needed for a detention pond routing spreadsheet.  The stage-storage information would typically be in the form of a table, graph, or equation showing the pond volume, V, as a function of the pond depth, h.  The stage-outflow information is typically in the form of an equation for outflow, O, as a function of pond depth, h, based on the type of outflow control device, as described in the next section.

Stage-Outflow Equations for a detention pond routing spreadsheet

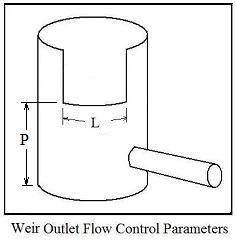
Detention Pond Routing Spreadsheet Weir Outlet DiagramA rectangular weir is one possible outflow control device, often in a riser as shown in the diagram at the left.  The equation for pond outflow  is:     O = CdL(h – P)1.5 where the parameters in the equation are as follow:

  • O = pond outflow = discharge over the rectangular weir in cfs for U.S. units (m3/s for S.I. units)
  • Cd = the discharge coefficient for the weir.  Typical value for U.S. units is 3.3 (1.84 for S.I. units)
  • L = weir length in ft for U.S. units (m for S.I. units)
  • h = stage (depth of water in pond) in ft for U.S. units (m for S.I. units)
  • P = height of weir crest above pond bottom in ft for U.S. units (m for S.I. units)

Equations like this are also available for an orifice outlet, two stage outlet, and pipe outlet.  These equations are given and used in the detention pond routing spreadsheet in either S.I. units or U.S. units in  our spreadsheet store.

The Storage Indication Routing Equation for Detention Pond Routing Spreadsheet Calculations

In addition to the input information described above, a routing equation is needed for a detention pond routing spreadsheet.  A commonly used routing equation is the Storage Indication Equation:

0.5(I1 + I2 )Δt  +  (S1 – 0.5O1Δt)  =  (S2 + 0.5O2Δt) Where:

  • Δt is the time interval used for the inflow and outflow hydrographs in minutes
  • I1 and I2 are successive values of the inflow from the inflow hydrograph (cfs – U.S. or m3/s – S.I.)
  • S1 is the initial value of pond storage (pond volume at the beginning of the storm in cfs – U.S. or m3/s – S.I.)
  • O1 is the initial outflow rate at the beginning of the storm in ft3 – U.S. or m3 – S.I.)
  • S2 and O2 are the pond storage and outflow respectively at time Δt after the beginning of the storm in the same units shown above.

For a given inflow hydrograph, I1, I2 , and all subsequent values of inflow for the duration of the storm are known.  Thus if the initial pond volume, S1, and initial pond outflow, O1, are known, then all of the parameters on the left hand side of the equation are known so the value of the right hand side of the equation (S2 + 0.5O2Δt) can be determined.

Now comes the elegant part of the storage indication routing procedure.  As described above S vs h and O vs h must be available, in the form of tables, graphs or equations.  Thus for any value of h, the parameter, S + 0.5OΔt can be determined and values of S and O can be determined for a known value of S + 0.5OΔt.  Thus, by stepwise calculations in a detention pond routing spreadsheet, the outflow hydrograph (O vs t) can be obtained.

An Excel Spreadsheet as a Pond Routing Calculator

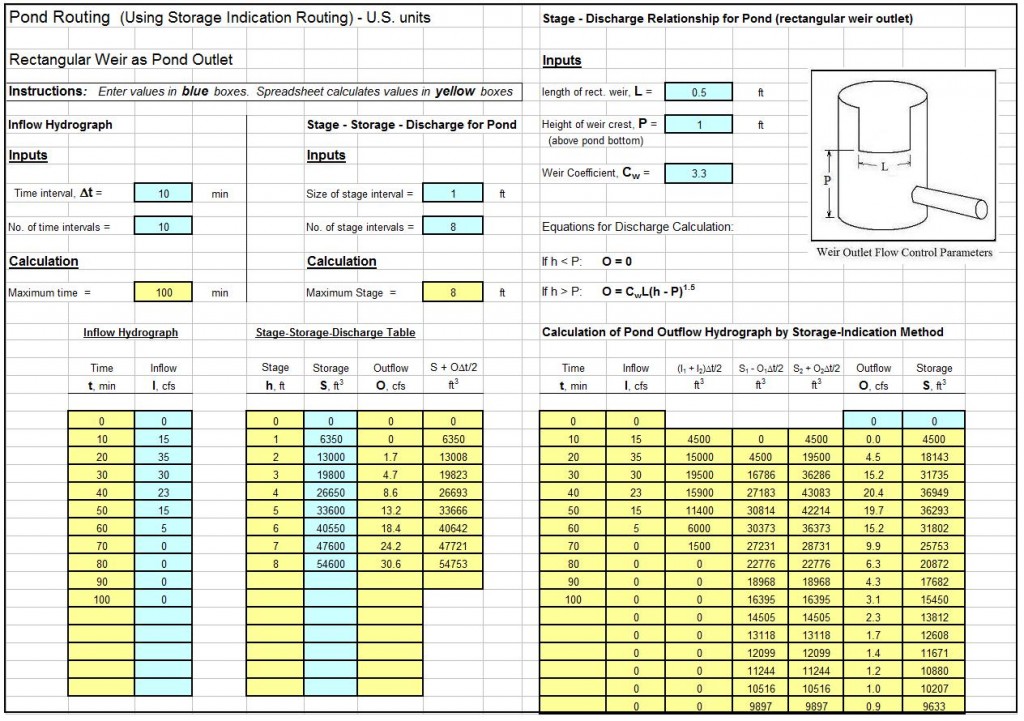
The template shown below is a  detention pond routing spreadsheet to carry out the procedure described above.   Why bother to make these calculations by hand?  This Excel spreadsheet can handle rectangular weir, orifice, two-stage (orifice/weir), pipe outflow control, and two-stage (pipe/weir), and is available in either U.S. or S.I. units at a very low cost in our spreadsheet store.  These spreadsheets also generates a table and graph showing the inflow and outflow hydrographs for a given set of input parameters.

screenshot of a detention pond routing spreadsheet

References

1. McCuen, Richard H., Hydrologic Analysis and Design, 2nd Ed, Upper Saddle River, NJ, 1998.


Minimum Pipe Wall Thickness Calculator Excel Spreadsheet

Where to Find a Minimum Pipe Wall Thickness Calculator Spreadsheet

For an Excel spreadsheet to use as a minimum pipe wall thickness calculator, click here to visit our spreadsheet store.  Read on for information about the use of an Excel spreadsheet as a minimum pipe wall thickness calculator.

The Barlow Formula for a Minimum Pipe Wall Thickness Calculator

The classic Barlow formula for calculating bursting pressure for a pipe is:

P = 2S*T/Do where:

  • Do is the outside diameter of the pipe with units of inches (U.S.) or mm (S.I.)
  • S is the strength of the pipe material with units of psi (U.S.) or N/mm2 (S.I.)
  • T is the wall thickness with units of inches (U.S.) or mm (S.I.)
  • P is the fluid pressure in the pipe with units of psi (U.S.) or MPa (S.I.)

If the ultimate tensile strength of the pipe material is used for S, then P will be the bursting pressure, while P will be the pressure at which permanent deformation of the pipe begins if S is the yield strength of the material.

The Barlow formula can be rearranged to: T = /Do*P/2S to use in a minimum pipe wall thickness calculator for the pipe wall thickness for a given bursting pressure or deformation pressure.

Calculation of Maximum Pipe Operating Pressure

The Barlow formula can be modified to calculate the maximum fluid operating pressure for a given pipe wall thickness and pipe diameter, by incorporation of a safety factor and corrosion allowance as follows:

P = 2S*(T – Tc)/SF*Do

where  SF is a safety factor (dimensionless) and Tc is a corrosion allowance in inches (U.S.) or mm (S.I.).  This equation uses the outside pipe diameter in the calculations, which is convenient, because the outside pipe diameter remains the same for all of the schedules (wall thicknesses) for a given nominal pipe size.  The calculation can be done using the outside pipe diameter (Do) in an equation based on the inside pipe diameter, by using the relationship,  Di =  Do –  2T , to give the equation:

P = 2S*(T – Tc)/SF*(Do –  2T)

Use of Equations in a Minimum Pipe Wall Thickness Calculator

The last equation in the previous section can be rearranged to give a pipe wall thickness formula as follows:

T = (P* SF*Do + 2S*Tc)/(2S + 2P*SF)

An Excel Spreadsheet as a Minimum Pipe Wall Thickness Calculator

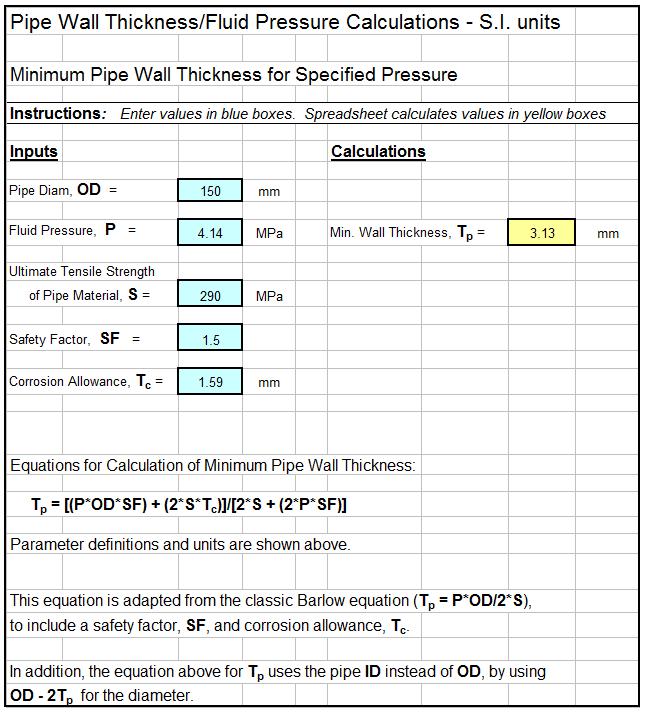
The Excel spreadsheet template shown below can be used as a minimum pipe wall thickness calculator or to calculate the maximum operating pressure in a pipe if the necessary other parameters are known/specified.   Why bother to make these calculations by hand?  This Excel spreadsheet and others for pipe flow calculations are available in either U.S. or S.I. units at a very low cost in our spreadsheet store.

Minimum Pipe Wall Thickness Calculator Spreadsheet


Spreadsheets for ISO 5167 Orifice Plate Flow Meter Calculations

Where to Find Spreadsheets for ISO 5167 Orifice Plate Flow Meter Calculations

For Excel spreadsheets to make ISO 5167 orifice plate flow meter calculations, click here to visit our spreadsheet store.  Why use online calculators or try to use the incredibly long ISO 5167 equations for hand calculations when you can buy a spreadsheet for gas flow or liquid flow, large bore or small bore ISO 5167 orifice plate flow meter calculations for only $15.95 each. Read on for information about the use of an Excel spreadsheet for large bore and small bore orifice meter/gas flow rate or liquid flow rate calculations.


Orifice Meter Background for ISO 5167 Orifice Plate Flow Meter Calculations

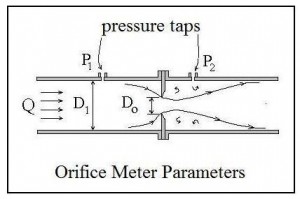
ISO 5167 Orifice Plate Flow Meter DiagramFor background on orifice meters and the orifice meter coefficient, see the articles, “Excel Spreadsheets for Orifice and Venturi Flow Meter Calculations” and “Calculate an Orifice Coefficient with ISO 5167.”  The diagram at the left shows the general orifice meter configuration and some of the parameters used in calculations.  Equations from ISO 5167-2:2003 are presented in the next section.

Equations for ISO 5167 Orifice Plate Flow Meter Large Bore Calculations

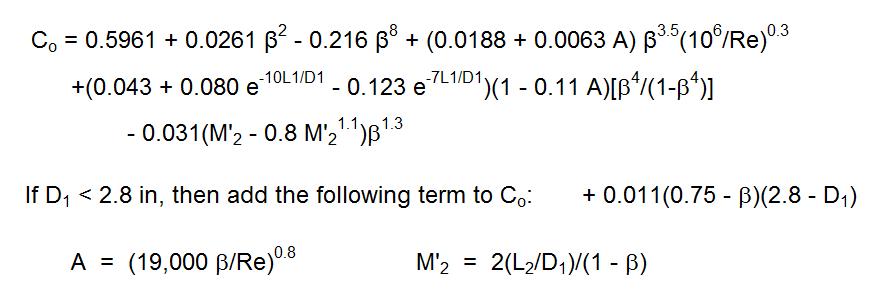
Equation for ISO 5167 Orifice Plate Flow Meter Spreadsheet CalculationsThe equations for pipes with diameter between 2 in. and 40 in (50 mm to 1000 mm) are given in Reference #1 at the end of this article, ISO 5167-2:2003.  The equations are summarized here.  The commonly used equation for compressible fluid (gas) flow rate is shown at the right, where the parameters are defined as follows:

  • Q = flow rate through pipe and meter, cfs (m3/s for S.I. units)
  • Co = orifice discharge coefficient, dimensionless
  • Ao = orifice  area, ft2 (m2 for S.I. units)
  • P1 = upstream absolute pressure in the pipe, lb/ft2 (kN/m2 for S.I. units)
  • P2 = pressure at the downstream pressure tap, lb/ft2 (kN/m2 for S.I. units)
  • β = Do/D1 = orifice diam./pipe diam., dimensionless
  • Z = compressibility factor of the gas at P1, T1
  • R = Ideal Gas Law Constant = 345.23 psia-ft3/slugmole-oR                                         ( or 8.3145 kN-m/kgmole-oK for S.I. units)
  • MW = molecular weight of the gas
  • T1 = upstream absolute temperature in the pipe, oR (oK for S.I. units)
  • Y = Expansion Factor – see equation for Y below

Y  =  1  –  (0.351  +  0.265 β4 +  0.93 β8)[ 1 – (P2/P1)1/k ]

where:  k is the Specific Heat Ratio (Cp/Cv) of the flowing gas

The orifice coefficient, Co, can be calculated from the following equations:

Where Re is the Reynolds number in the pipe  ( Re  =  DVρ/μ )

An Excel Spreadsheet as an Orifice Meter/Gas Flow Calculator

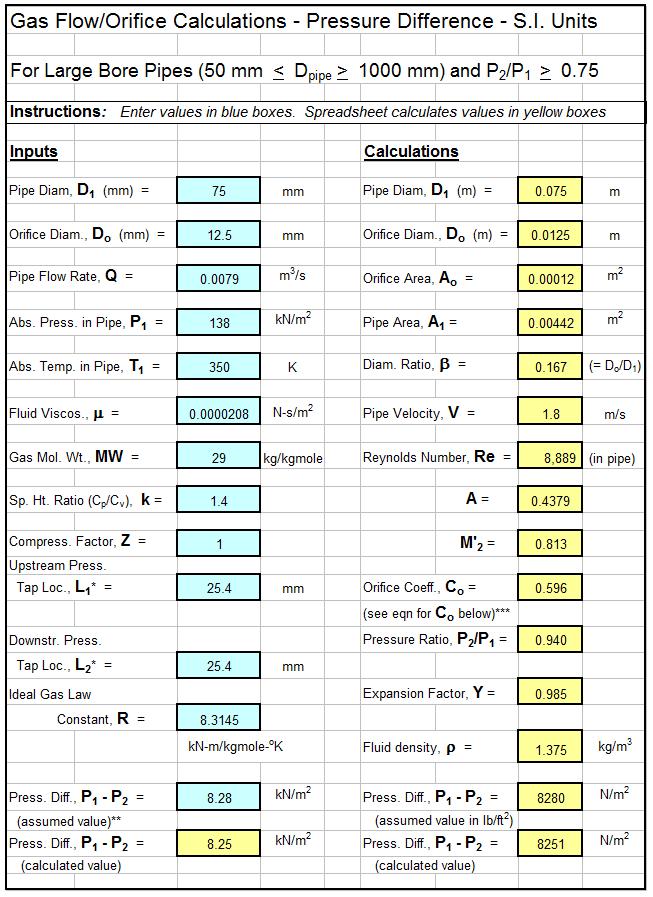
The Excel spreadsheet template shown below can be used to calculate gas flow rate, required orifice diameter, or pressure difference across the orifice, if the other two are known.  This spreadsheet is for large bore pipes (2 in. to 40 in diameter) and uses S.I. units.   The image shows just the first page of the worksheet to calculate gas flow rate.  Why bother to make these calculations by hand?  This Excel spreadsheet and others with similar calculations for ISO 5167 orifice plate flow meter calculations are available in either U.S. or S.I. units at a very low cost (only $14.95 each) in our spreadsheet store.  There are also spreadsheets for large bore orifice meter calculations for liquid flow and for small bore orifice meter calculations (gas flow or liquid flow).  The small bore spreadsheets are for pipes with diameter between 1/2 inch and 1 1/2 inches (12 mm to 40 mm), and use slightly different equations from ASME MFC-14M:2001.

Screenshot of ISO 5167 Orifice Plate Flow Meter Excel Spreadsheet

References:

1. U.S. Dept. of the Interior, Bureau of Reclamation, 2001 revised, 1997 third edition, Water Measurement Manual.

2. International Organization of Standards – Measurement of fluid flow by means of pressure differential devices inserted in circular cross-section conduits running full. Reference number: ISO 5167-2:2003.

4. Bengtson, Harlan H., “Orifice or Venturi Pipe Flow Meters: for Liquid Flow or Gas Flow,” an Amazon Kindle ebook.

5. Bengtson, Harlan H., “Flow Measurement in Pipes and Ducts,” an online, self-study, continuing education course for Professional Engineers at www.CEDengineering.com.

6. Bengtson, Harlan H., “Orifice and Venturi Meters Pipe Flow Meters – for Liquid and Gas Flow,” an online, self-study, continuing education course for Professional Engineers at www.suncam.com.

7. Bengtson, Harlan H. “Orifice Gas Flow Calculation Excel Spreadsheets,” an online blog article.


Storm Water Drain Inlet Calculations Spreadsheet

Introduction

For a storm water drain inlet calculations spreadsheet, click here to visit our spreadsheet store.  Read on for information about storm water inlet design and Excel spreadsheets to do the calculations.

Design of storm water drain inlets is basically determining the size opening needed to handle the design peak storm water runoff rate, for the particular type of inlet opening.  The links above also have spreadsheets for calculating the peak storm water runoff rate with the Rational Method equation.

Types of Pavement Drain Inlets

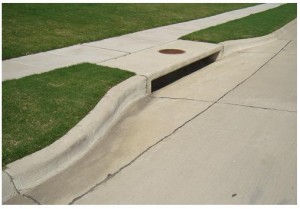
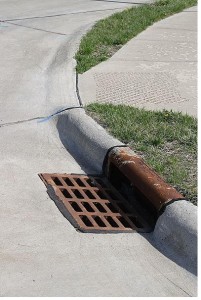
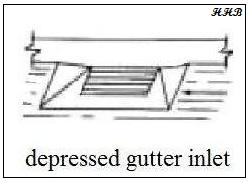
stormwater drain inlet calculations spreadsheet curb inlet figureThe types of pavement drain inlets in common use include curb inlets, gutter inlets and combination inlets.  A curb inlet is just an opening in the curb as shown in the image at the stormwater drain inlet calculations spreadsheet gutter inlet figureleft.  A combination inlet has both a curb opening and a grate opening in the bottom of the gutter as shown in the image at the right.  Gutter inlets typically have a grate over the opening, while curb inlets are storm water drain inlet calculations spreadsheet depressed gutter inlettypically open without a grate, as shown in the pictures.  A sketch of a depressed gutter inlet is shown at the bottom left.

Curb Inlet Image Credit: Lone Star Manhole and Structures

Combination Inlet Image Credit: Robert Lawton – Wikimedia Commons

Depressed Gutter Inlet Image Credit:  H. H. Bengtson

The Weir Model for Sizing Storm Water Drain Inlets

The openings for storm water drains can be modeled as a weir if the opening isn’t completely submerged at the design storm water runoff flow rate.  For a curb opening this would be the case if the depth of storm water at the opening is less than the height of the opening.  For a gutter opening it would occur if the design flow rate of storm water runoff enters the grate around the edges, without completely submerging the opening.

The equation used to size storm drains with unsubmerged openings is theC sharp crested weir equation:  Q = CwLd1.5, where:

  • Q = the design storm water runoff rate that must flow through the inlet in cfs for U.S. or m3/s for S.I. units.
  • Cw = a weir coefficient, which is a dimensionless constant.  Typical values are 2.3 for U.S. units and 1.27 for S.I. units.
  • L = the length of the curb opening (or the length of the the gutter opening in the direction of the storm water flow), in ft for U.S. or m for S.I. units.
  • d = the depth of storm water above the bottom of the curb opening or its depth above the gutter inlet opening in ft for U.S. or m for S.I. units.

The Orifice Model for Sizing Storm Water Drain Inlets

The storm water drain opening can be modeled as an orifice if it will be completely submerged at design flow of storm water runoff.  This would be the case for a curb opening if the water depth is more than the height of the curb opening at design storm water flow.  A gutter opening could be modeled as a weir if the gutter opening is completely submerged at the design storm water runoff rate.  The equation used for sizing storm water inlets with the orifice model is:

Q = Co A(2gde)1/2 ,  where:

  • Q = the design storm water runoff rate that must flow through the inlet in cfs for U.S. or m3/s for S.I. units.
  • Co = the orifice coefficient, which is dimensionless.  The value typically used for storm water inlet design is 0.67.
  • A = the area of the inlet opening in ft2 for U.S. or m2 for S.I. units.
  • g = the acceleration due to gravity (32.2 ft/sec2 for U.S. or 9.82 m/s2 for S.I units).
  • de = the height of storm water above the centroid of the opening in ft for U.S. or m for S.I. units.

Note that de = d – h/2, for a curb opening, where d is the depth of storm water above the bottom of the opening and h is the height of the curb opening.  For a gutter opening,  de = d, where d is the height of storm water above the gutter opening at design storm water flow.

An Excel Spreadsheet as a Storm Water Drain Inlet Design Calculator

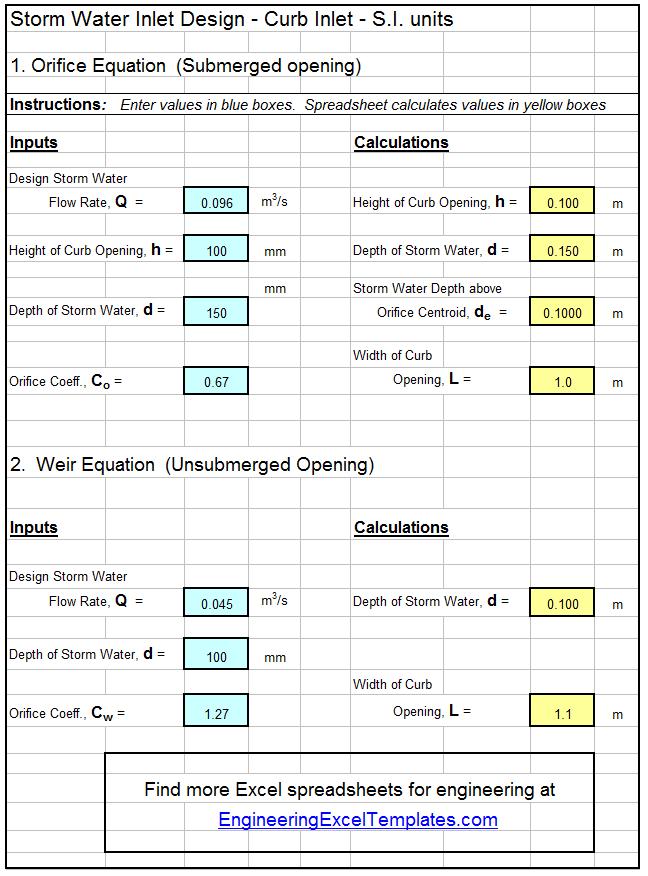
The Excel spreadsheet template shown below can be used to calculate the required size of a curb inlet for storm water drainage, based on specified information about the design storm water runoff rate, height of the curb opening, and the height of the storm water above the bottom of the opening.  Why bother to make these calculations by hand?  This Excel spreadsheet and others with similar calculations for a gutter opening are available in either U.S. or S.I. units at a very low cost in our spreadsheet store.

storm water inlet calculations spreadsheet

References:

1. McCuen, Richard H., Hydrologic Analysis and Design, 2nd Ed, Upper Saddle River, NJ, 1998.

2. ASCE. 1992. Design and Construction of Urban Stormwater Management Systems. The Urban Water Resources Research Council of the American Society of Civil Engineers (ASCE) and the Water Environment Federation. American Society of Civil Engineers, New York, NY.

3. Texas Department of Transportation/Online Hydraulic Design Manual/Storm Drain Inlets.


Heat Exchanger Thermal Design Calculations Spreadsheet

Where to Find a Heat Exchanger Thermal Design Calculations Spreadsheet

For a double pipe heat exchanger thermal design calculations spreadsheetclick here to visit our spreadsheet store.  Read on for information about the use of a heat exchanger design thermal design calculations spreadsheet for a double pipe heat exchanger.

The Basic Equation for a Heat Exchanger Thermal Design Calculations Spreadsheet

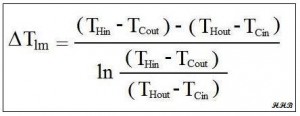
The basic heat exchanger design equation is:  Q = U A ΔTlm,    where:

  • Q = the rate of heat transfer between the two fluids in the heat exchanger in But/hr (kJ/hr for S.I. units)
  • U is the overall heat transfer coefficient in Btu/hr-ft2oF  (kJ/hr-m2-K for S.I. units)
  • A is the heat transfer surface area in ft2 (m2 for S.I. units)
  • ΔTlm is the log mean temperature difference in oF,  (K for S.I units)  calculated from the inlet and outlet temperatures of both fluids.

For a heat exchanger thermal design calculations spreadsheet, the heat exchanger equation can be used to calculate the required heat exchanger area for known or estimated values of the other three parameters, Q, U, and ΔTlm.  Each of those parameters will be discussed briefly in the next three sections.

The Log Mean Temperature Difference, ΔTlm , for a Heat Exchanger Design Spreadsheet

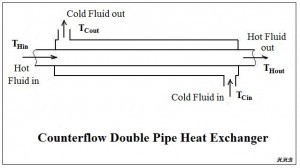
Equation for heat exchanger thermal design calculations spreadsheetThe driving force for a heat transfer process is always a temperature difference. For heat exchangers, there are always two fluids involved, and the temperatures of both are changing as they pass through the heat exchanger.  Thus some type of average temperature difference is needed.  Many heat transfer textbooks (e.g. ref #1 below) show double pipe heat exchanger diagram for heat exchanger thermal design calculations spreadsheetthat the log mean temperature difference is the appropriate average temperature difference to use for heat exchanger design calculations.  The definition of the log mean temperature difference is shown in the figure above.  The meanings of the four temperatures in the log mean temperature difference equation are rather self explanatory as shown in the diagram of a counterflow double pipe heat exchanger at the right.

The Heat Transfer Rate, Q, for a Heat Exchanger Thermal Design Calculations Spreadsheet

In order to use the heat exchanger design equation to calculate a required heat transfer area,  a value is needed for the heat transfer rate, Q.  This rate of heat flow can be calculated if the flow rate of one of the fluids is known along with its specific heat and the required temperature change for that fluid. The equation to be used is shown below for both the hot fluid and the cold fluid:

Q = mH CpH (THin – THout) = mC CpC (TCout – TCin), where

  • mH is the mass flow rate of the hot fluid in slugs/hr (kg/hr for S.I. units).
  • CpH is the specific heat of the hot fluid in Btu/slug-oF (kJ/kg-K for S.I. units).
  • mC is the mass flow rate of cold fluid in slugs/hr (kg/hr for S.I. units).
  • CpC is the specific heat of the cold fluid in Btu/slug-oF (kJ/kg-K for S.I. units).
  • The temperatures (THin, THout, TCout, & TCin) are the hot and cold fluid temperatures going in and out of the heat exchanger, as shown in the diagram above.  They should be in oF for U.S. or K for S.I. units.

The heat transfer rate, Q, can be calculated in a preliminary heat exchanger design spreadsheet if the flow rate, heat capacity and temperature change are known for either the hot fluid or the cold fluid. Then one unknown parameter can be calculated for the other fluid.  (e.g. the flow rate, the inlet temperature, or the outlet temperature.)

The Overall Heat Transfer Coefficient, U, for a Heat Exchanger Design Spreadsheet

The overall heat transfer coefficient, U, depends on the convection coefficient inside the pipe or tube, the convection coefficient on the outside of the pipe or tube, and the thermal conductivity of the pipe wall.  See the article, Forced Convection Heat Transfer Coefficient Calculations, for information about calculating the heat transfer coefficients and click here to visit our spreadsheet store, for spreadsheets to calculate the inside and outside convection coefficients and to calculate the overall heat transfer coefficient.

A Heat Exchanger Thermal Design Calculations Spreadsheet

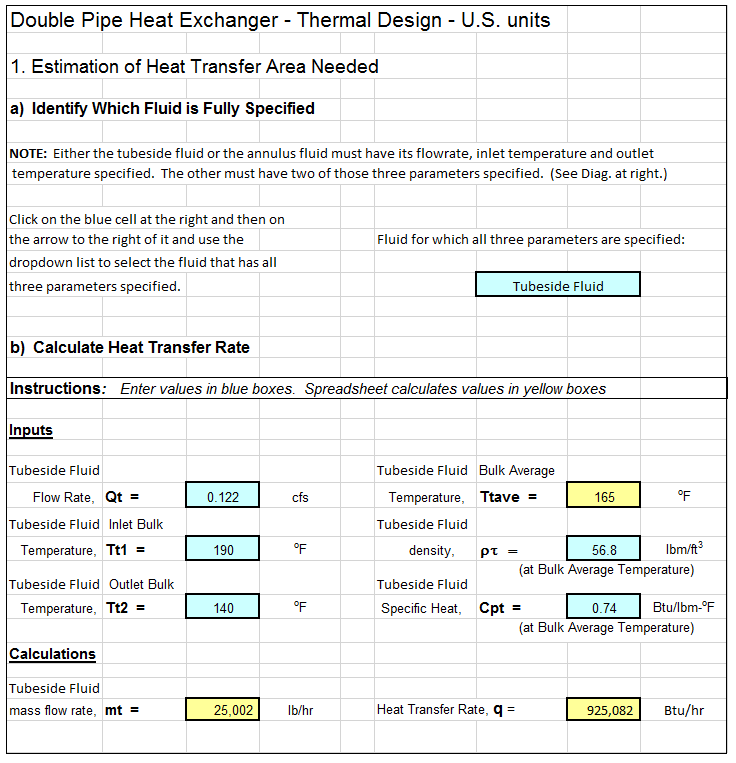
The screenshot below shows a heat exchanger thermal design calculations spreadsheet that can be used to carry out thermal design of a double pipe heat exchanger.  The image shows only the beginning of the calculations.  The rest of the spreadsheet will calculate the length of pipe needed, the length of each pass for a selected number of 180 degree bends, and the pressure drop through the inside of the pipe.  Why bother to make these calculations by hand?  This Excel spreadsheet is available in either U.S. or S.I. units at a very low cost at in our spreadsheet store.

Heat Exchanger Thermal Design Calculations Spreadsheet

References

1. Kuppan, T., Heat Exchanger Design Handbook, CRC Press, 2000.

2. Kakac, S. and Liu, H., Heat Exchangers: Selection, Rating and Thermal Design, CRC Press, 2002.

3. Bengtson, H., Fundamentals of Heat Exchangers, an online, continuing education course for PDH credit.

4. Bengtson, H., Thermal Design of a Double Pipe Heat Exchanger, and online blog article.