Storm Sewer Hydraulic Design with Excel Spreadsheets

Where to Find Storm Sewer Hydraulic Design Spreadsheets

For storm sewer hydraulic design spreadsheets, click here to visit our spreadsheet store.  Read on for information about the use of Excel spreadsheets for storm sewer hydraulic design calculations with the Manning Equation.

One part of storm sewer hydraulic design is determination of the design pipe diameter and sewer slope for the storm sewer pipe between adjacent manholes.  Although storm sewers are circular pipes, the storm water typically flows under gravity, rather than as pressure flow, so the Manning equation for open channel flow can be used for the calculations.  A storm sewer hydraulic design spreadsheet typically makes hydraulic calculations for full pipe flow.  For full pipe flow, the hydraulic radius becomes: R = A/P = (πD2/4)/(πD) = D/4.

The Manning Equation in a Storm Sewer Hydraulic Design Spreadsheet

The general form of the Manning equation in terms of velocity is: V = (1.49/n)(R2/3)(S1/2) for U.S. units and  V = (1.0/n)(R2/3)(S1/2) for S.I. units.  As noted above, R = D/4 for full pipe flow, so the Manning equation in U.S. units becomes  V = (1.49/n)[(D/4)2/3](S1/2) -U.S. units or V = (1.0/n)[(D/4)2/3](S1/2) – S.I units, for full pipe, gravity flow in a storm sewer pipe.  The parameters in the equations are as follows:

  • V is the flow velocity in the pipe (ft/sec – U.S. and m/s – S.I.).
  • n is the Manning roughness coefficient, an empirical, dimensionless constant.
  • D is the pipe diameter (ft -U.S. and m – S.I.).
  • S is the pipe slope, which is dimensionless.

The volumetric flow rate is related to the other parameters through the equation Q = VA or, for a circular pipe flowing full:  Q = (πD2/4)V, where Q will be in cfs for U.S. units or m3/s for S.I. units.

Calculation of Diameter and Slope with a Storm Sewer Hydraulic Design Spreadsheet
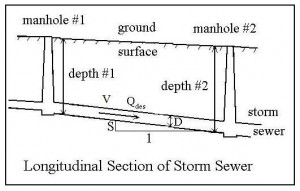
Diagram for Storm Sewer Hydraulic Design SpreadsheetThe required diameter and slope for the length of storm sewer between two manholes can be calculated with a storm hydraulic sewer design spreadsheet using the equations presented in the last section (Mannings equation and Q = VA) together with the typical design criteria that 1) the full pipe flow rate that the pipe can carry must be at least equal to the design peak storm water runoff rate to the inlet for that section of storm sewer and 2) the full pipe velocity must be equal to or greater than a specified minimum velocity.  The diagram above shows a sectional view of a storm sewer pipe between two manholes and the parameters being discussed here. The calculation procedure is illustrated by the example in the next section.

Example Storm Sewer Hydraulic Design Calculations

Problem Statement: For a section of storm sewer between two manholes, the design flowrate is: Qdes = 6.4 cfs. The required minimum full pipe storm water velocity is: V min= 3 ft/sec.  The Manning roughness coefficient (concrete pipe) is: n = 0.011.  Find a standard pipe diameter and sewer slope that will meet the two criteria: Qfull > Qdes and Vfull > Vmin for this section of storm sewer pipe.

Problem Solution: First the pipe diameter needed for a full pipe velocity of 3 ft/sec at design flow rate will be calculated using the equation: Q = VA.   Then the Manning equation will be used to calculate the sewer slope needed to give full pipe velocity equal to 3 ft/sec with the next larger standard pipe size.

Step 1:  The equation, Q = VA becomes: Qfull = Vfull(πD2/4). Substituting known values for Qfull and Vfull, the equation becomes: 6.4 = 3(πD2/4).  Solving for D gives: D = 1.65 ft = 19.8 in.  From the list of standard storm sewer pipe sizes in the next section it can be seen that the next standard size larger than 19.8 inches is 21 “, so that will be used for the diameter.

The Manning equation will then be used to calculate the slope for D = 21 in. = 1.75 ft, and V = 3 ft/sec. The Manning equation is: V = (1.49/n)[(D/4)2/3](S1/2).  Substituting values for V, D, and n gives:  3 = (1.49/0.011)[(1.75/4)2/3](S1/2).  Solving this equation for S gives: S = 0.00148.

Thus, the solution is: D = 21″, S = 0.00148. These values of D and S will give Qfull > 6.4 cfs, because Qfull = 6.4 cfs for Vfull = 3 ft/sec and D = 19.8″. With D = 21 ” and V = 3 ft/sec, Qfull must be greater than 6.4 cfs. The equation Q = (πD2/4)V can be used to check this.

Standard Pipe Sizes

Standard U.S. pipe sizes in inches for most types of pipe used as storm sewers:                          4, 6, 8, 10, 12, 14, 16, 18, 21, 24, 27, 30, 33, 36, 39, 42, 48, 54, 60

Standard S.I. pipe sizes in mm for most types of pipe used as storm sewers:                           100, 150, 200, 250, 300, 350, 400, 450, 500, 600, 650, 700, 750, 800, 850, 900, 950, 1000, 1050

Use of Excel Spreadsheets for Storm Sewer Design Calculations

For information on making storm sewer calculations with Excel spreadsheets, see the related article: “Excel Spreadsheets for Storm Sewer Hydraulic Design.”  For low cost, easy to use spreadsheets for several types of storm water calculations, including storm sewer hydraulic design, click here to visit our spreadsheet store.

References

1. Bengtson, Harlan H., Hydraulic Design of Storm Sewers, Including the Use of Excel, an online, continuing education course for PDH credit.

2. McCuen, Richard H., Hydrologic Analysis and Design, 2nd Ed, Upper Saddle River, NJ, Prentice Hall, 1998.

3. Steele, E.W. and McGhee, T.J., Water Supply and Sewerage, New York, NY, McGraw-Hill Book Co, 1979.

4. Bengtson, Harlan H., Hydraulic Design of Storm Sewers with a Spreadsheet,” an Amazon Kindle ebook

5. Bengtson, Harlan H., “Hydraulic Design of Storm Sewers with Excel”  an online blog article.


Storm Sewer Design Spreadsheet Calculations

Where to find a Storm Sewer Design Spreadsheet

For a storm sewer design spreadsheetclick here to visit our spreadsheet store.  Read on for information about the use of Excel spreadsheets for storm sewer design calculations.

The storm sewer design spreadsheet discussed in this article uses Excel formulas with the rational method to find design storm water runoff rate and the Manning equation to find pipe diameter and slope.

The hydraulic portion of stormwater sewer design proceeds in the form of calculations between each pair of manholes in the storm sewer line. The first part of the spreadsheet is essentially a rational method design spreadsheet used to determine the design stormwater runoff flow rate for each section of storm sewer being designed. The next part of the spreadsheet is used to calculate the pipe diameter and slope for each section of storm sewer with the Manning Equation. Finally, the pipe invert elevation at each manhole is calculated in the last part of the spreadsheet.  Each part of the storm sewer design spreadsheet will be discussed briefly in the next several sections, followed by presentation and discussion of an Excel spreadsheet template to make the calculations.

Peak Storm Water Runoff Rate for Storm Sewer Design Spreadsheet

The rational method equation (Q = CiA for U.S. units and Q = 0.0028 CiA for S.I. units) is widely used to calculate the design stormwater runoff rate to use for a variety of storm water projects, including storm water sewer design.  The parameters in the rational method equations are:

  • Q, the design storm water runoff rate (cfs – U.S. and m3/s – S.I.)
  • C, the runoff coefficient, which is an estimate of the fraction of rainfall that becomes surface runoff (dimensionless)
  • i, the design rainfall intensity (in/hr – U.S. and mm/hr – S.I.)
  • A, the runoff area that drains to the section of sewer pipe being designed (acres – U.S. and ha – S.I.)

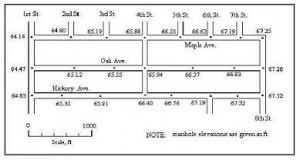
Manhole Map for Storm Sewer Design Spreadsheet ExampleThe storm sewer design spreadsheet being discussed here will assume that the manhole locations have already been determined, as shown in the diagram above.  A street map like this would be used to determine the area draining to each of the manhole inlets for the length of storm sewer being designed.

Criteria Used in Storm Sewer Design Spreadsheet

Following are the criteria typically used to calculate the design pipe diameter and sewer slope for a length of sewer pipe:

  1. The pipe must be sized to carry the design peak stormwater runoff rate.
  2. The velocity in the sewer pipe must be greater than or equal to the design minimum velocity (usually 3 ft/s).

The use of these design criteria, together with the Manning equation

[ Q = (1.49/n)(A)(R2/3)(S1/2) ]  and Q = VA, to calculate the pipe diameter and slope is discussed and illustrated with an example in the article, “Storm Sewer Hydraulic Calculations with the Manning Equation.”  The procedure is also illustrated in the spreadsheet template presented later in this article.

Invert Elevations at Manholes in the Storm Sewer Design Spreadsheet

The sewer pipe invert elevation (or depth) at the uppermost manhole is determined by the minimum required depth of cover above the sewer pipe to protect it from freezing. This required minimum cover is usually specified by a state or local agency.  For subsequent manholes, the required minimum cover, the required pipe slope, and the ground surface elevations from a street/manhole map like that shown in a previous section above, are used to calculate the pipe invert elevations.  Calculation of the invert elevations at manholes with a storm sewer design spreadsheet is presented in the next section.

Putting it together in a Storm Sewer Design Spreadsheet

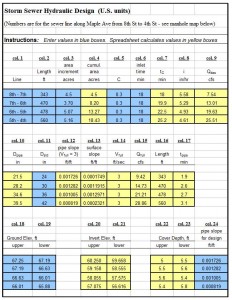
The storm sewer design spreadsheet template shown in the two images below contains design calculations for a storm sewer line along one of the streets on the manhole layout map shown above in the second section of this article.  The spreadsheet makes the calculations described above.  The various parts of the spreadsheet will now be discussed briefly with reference to the column numbers given on the spreadsheet.

Columns 1, 2, and 3 contain information from a scale street/manhole map, such as the one shown earlier in this article. Column 4 is the calculated cumulative area draining to downstream sections of storm sewer pipe. The uppermost part of the sewer line in this example is the manhole at 8th Street and Maple Avenue.  An estimate of the runoff coefficient is given in column 5.  Column 6 shows the inlet time from the farthest point in the drainage area. For the uppermost section of sewer pipe, the inlet time is equal to the time of concentration.  For the other sections of sewer pipe in the line being designed, the time of concentration is the inlet time to the first inlet plus the pipe flow time to the inlet of the pipe section currently being designed.  This is calculated in column 7.

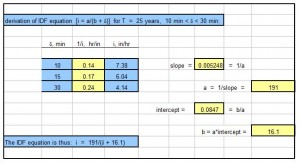
Column 8 is the calculated design rainfall intensity. The portion of the Excel template shown at the right below has the Excel formulas for derivation of an equation for storm intensity vs storm duration for a given return period, using linear regression of storm duration, δ, vs the inverse of storm intensity, 1/i.   This requires at least some values of i vs δ, from  I-D-F data for the location of interest.  This linear regression makes use of the fact that the relationship between i and δ is typically of the form i = a/(δ + b), where a and b are constants. Column 9 is the calculation of peak storm water runoff rate (the design flow rate) with the rational method equation:  Q = CiA.

Columns 10 through 15 use of the Manning Equation and Q = VA to determine the minimum standard pipe diameter and sewer slope needed, as well as to make a check on Vfull and Qfull when the pipe is receiving the design stormwater runoff flow rate.  This set of calculations is discussed in some detail in the article: Storm Sewer Hydraulic Calculations with the Manning Equation.”

Columns 16 and 17 are used to calculate the pipe flow time to be used for the time of concentration calculation in column 7. Columns 18 and 19 give ground surface elevations taken from the manhole layout map. Columns 20 and 21 calculate the pipe invert elevations. The invert elevation of the uppermost end of the pipe is taken to be the surface elevation minus the minimum cover (taken to be 5′ ) plus the pipe diameter. The invert elevation at the lower end of the pipe section is calculated using the sewer slope that was previously determined. Columns 22 and 23 are a check on the depth of cover at each manhole, and column 24 is a listing of the final design pipe slope.

For a low cost, easy to use storm water design spreadsheet and spreadsheets for several other types of storm water calculations, click here to visit our spreadsheet store.

screenshot of part of a storm sewer design spreadsheet

References

1. Bengtson, Harlan H., Hydraulic Design of Storm Sewers, Including the Use of Excel, an online, continuing education course for PDH credit.

2. McCuen, Richard H., Hydrologic Analysis and Design, 2nd Ed, Upper Saddle River, NJ, 1998.

3. Knox County Tennessee, Stormwater Management Manual, section on the Rational Method

4. Bengtson, Harlan H., Hydraulic Design of Storm Sewers with a Spreadsheet,” an Amazon Kindle ebook

5. Bengtson, Harlan H., “Hydraulic Design of Storm Sewers with Excel”  an online blog article.