Introduction to Hydrology/Hydrograph Calculations Excel Spreadsheets
For hydrologyhydrograph calculations Excel spreadsheets, click here to visit our spreadsheet store. Read on for information about hydrographs, their components and baseflow separation.
Use of hydrographs in hydrology applications often involves calculations with tables of values. Thus Excel spreadsheets are very useful for such calculations. Read on for information about the components of hydrographs, baseflow separation, generation of unit hydrographs and use of unit hydrographs.
What is a Hydrograph?
For use in hydrology, the term hydrograph means a graph or table of values showing the changes in flow rate over time at a point on a river or stream or some other point of interest. Possible points of interest for a hydrograph include locations like a storm water drainage outlet from a drainage area or the entrance to a storm water detention system. Hydrographs are used to show flow patterns following a storm, thus providing information about the storm water runoff rate at the point of interest.
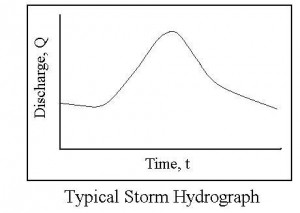
 For a storm hydrograph at a point on a river or stream, there will typically be a gradually decreasing flow rate before the beginning of the storm. After the storm begins, the flow rate increases as storm water runoff from more of the drainage area reaches the river. The flow rate (discharge) will typically increase to a peak value and then gradually decrease to the pre-storm level again, as shown in sample hydrograph in the figure at the right. For a hydrograph where there’s no non-storm water flow, the hydrograph will start at zero flow prior to the storm and go back down to zero flow.
Hydrograph Components – Baseflow and Direct Runoff
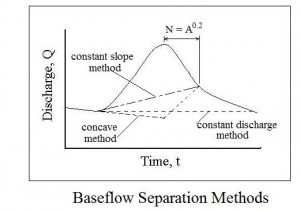
 The flow represented by a hydrograph for a point on a river or stream is considered to be made up of two parts, the baseflow, which is the normal dry weather flow of the river or stream, and direct runoff, which is the component of flow due to storm water runoff. The direct runoff due to the storm is often the part that is of interest. In order to determine the direct runoff from a storm, its necessary to separate the baseflow from the hydrograph, leaving the direct runoff hydrograph. The diagram at the left shows three methods used for baseflow separation: the constant discharge method; the constant slope method; and the concave method.
The constant discharge method simply uses a horizontal line from the point where the hydrograph begins to rise to its intersection with the receding limb. The baseflow separation line for both the constant slope method and the concave method should intersect with the receding limb at the inflection point (where the receding limb changes from convex to concave). The time from the peak of the hydrograph to the inflection point of the receding limb is often calculated with the equation: N = A0.2, as shown on the diagram. This is a dimensional equation, in which A is the watershed area in mi2, and N is time in days. The constant slope method uses a straight line from the point where the hydrograph begins to rise to the inflection point on the receding limb. The concave method extends the pre-storm slope of the baseflow line to a point directly below the peak and then uses a straight line to the inflection point on the receding limb.
For Excel spreadsheets to make a variety of hydrograph calculations, including baseflow separation by the concave method, click here to visit our spreadsheet store.
Reference
McCuen, Richard H., Hydrologic Analysis and Design, 2nd Ed, Upper Saddle River, NJ, 1998.

